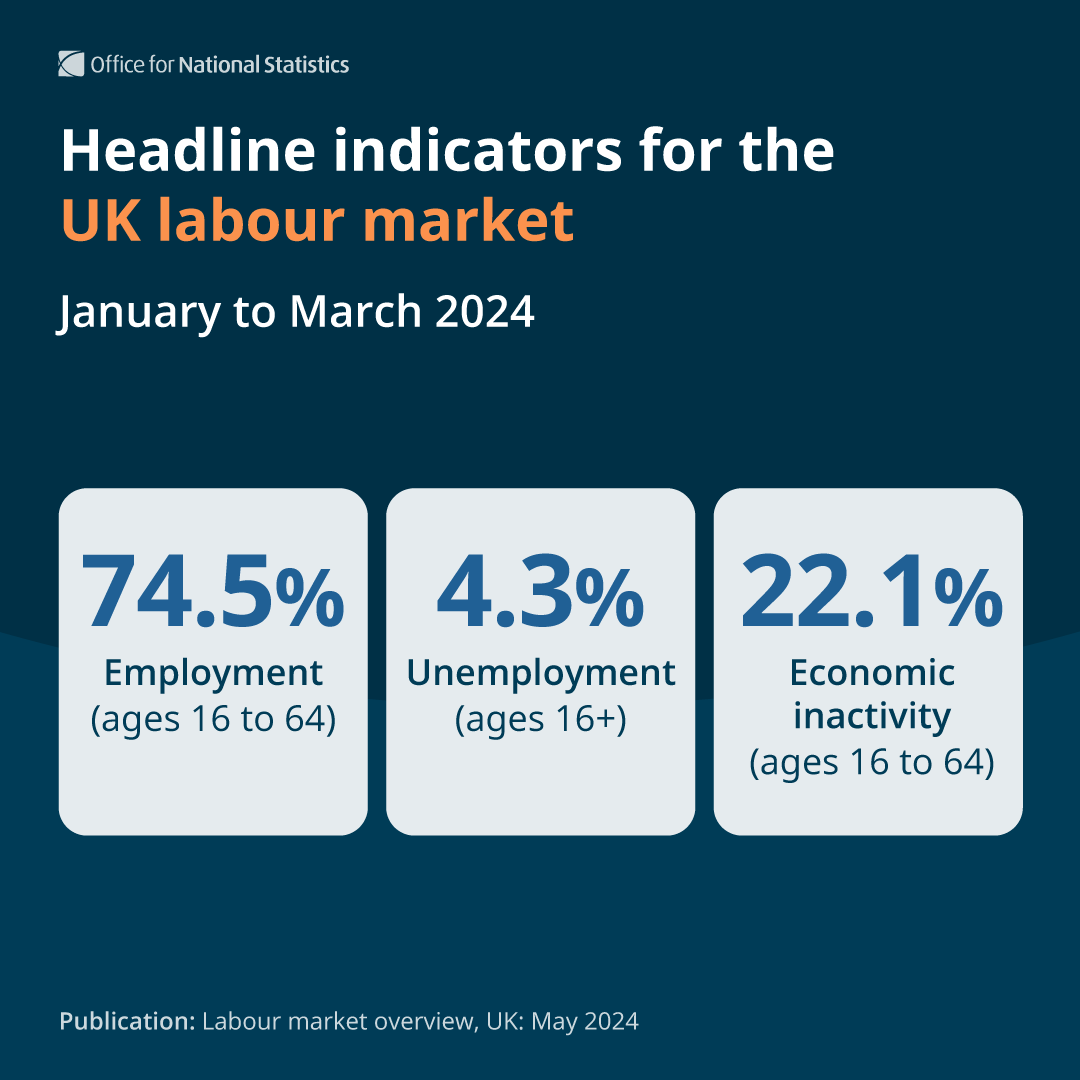
Headline indicators for the UK labour market for February to April 2021 show
▪️ employment was at 75.2%
▪️ unemployment was at 4.7%
▪️ economic inactivity was at 21.0%
➡️ ow.ly/ErOi50FaoXh
▪️ employment was at 75.2%
▪️ unemployment was at 4.7%
▪️ economic inactivity was at 21.0%
➡️ ow.ly/ErOi50FaoXh

The number of employees on payroll rose by 197,000 in May 2021.
This was still 553,000 fewer than before the pandemic (February 2020) ow.ly/IQG050Fap25
This was still 553,000 fewer than before the pandemic (February 2020) ow.ly/IQG050Fap25

975.2 million hours were worked each week in February to April 2021.
This is an increase of 7.2 million hours on the previous three months, reflecting the relaxation of #COVID19 restrictions, but still below pre-pandemic levels ow.ly/Svpx50Fap3N
This is an increase of 7.2 million hours on the previous three months, reflecting the relaxation of #COVID19 restrictions, but still below pre-pandemic levels ow.ly/Svpx50Fap3N

After allowing for inflation, average pay (whether including or excluding bonuses) was growing at an annual rate of 4.4% in February to April 2021.
This was impacted by some statistical factors, and the underlying picture suggests more modest pay rises ow.ly/n7sM50Fap5m
This was impacted by some statistical factors, and the underlying picture suggests more modest pay rises ow.ly/n7sM50Fap5m
There were 758,000 job vacancies in March to May 2021, just below the pre-pandemic level.
However, most industries recovered to show vacancies above pre-pandemic levels - and sectors such as hospitality have seen strong rises ow.ly/b7y550Fap6W
However, most industries recovered to show vacancies above pre-pandemic levels - and sectors such as hospitality have seen strong rises ow.ly/b7y550Fap6W

There were 5.67 million public sector employees in March 2021.
This is an increase of 1.3% since December 2020 following rises throughout 2020 - partly due to the response of the National Health Service and the Civil Service to the #COVID19 pandemic ow.ly/4ghx50Fap86
This is an increase of 1.3% since December 2020 following rises throughout 2020 - partly due to the response of the National Health Service and the Civil Service to the #COVID19 pandemic ow.ly/4ghx50Fap86
• • •
Missing some Tweet in this thread? You can try to
force a refresh


