Translation of key portions of the public statement from China's National Energy Administration (NEA) July press conference re: power supply and demand during the 2025 summer peak.
These comments were from Deputy Director Liu Mingyang of the NEA's Electric Power Department:
"Friends from the media, good morning. Next, I will introduce the power supply situation during this summer's peak demand period.
First, power loads during the summer peak repeatedly set new record highs. In July, peak temperatures were seen, with most provinces experiencing average temperatures 1-2 degrees C higher than the same period in the past. Together with the end of the rainy season in the south, the weather has been hot and humid.
GDP grew by 5.3% YoY in the first half of the year, rapidly driving power loads higher, increasing by over 200 GW versus the end of June. The national peak power load successively saw new records on July 4th, 7th, 16th, and 17th, exceeding 1500 GW and finally reaching a peak of 1508 GW, which is 57 GW higher than the peak load record last year. To date, 19 provinces have seen record-high peak loads, including Jiangsu, Shandong, and Guangdong, breaking records 46 times."
"Second, power supply across the country has been stable overall. In the first half of the year, over 200 GW of new generating capacity was brought online, including 30 GW of supporting and regulating power sources [DF: here, this means dispatchable capacity] including hydropower, gas-fired power, and coal-fired power. Three new cross-region transmission corridors were brought online, increasing cross-region transmission capacity by 16 GW. [DF: this means new UHV lines]
In July, another 10 GW of additional dispatchable capacity was connected to the grid, further strengthening the power supply guarantee. Since summer's start, all kinds of supporting and regulating power have been fully operating. Primary fuels including thermal coal and natural gas have been amply supplied, ensuring stable and orderly national power supply, with only Sichuan needing to implement demand response measures on the evening of the 17th. This demonstrates the system has withstood its first round of high-temperature, high-load challenges this summer."
[DF: This is the first I hear of this, but if Sichuan was truly the only province to use its demand response mechanism during the July peak, then it's quite impressive. I'm quite curious how August has been so far...I have heard some buzz that we might have set ANOTHER new peak a few days ago. Guess we'll find out in the August press conference later this week.]
Chinese power consumption soared to a staggering all-time high of 1,023 TWh (or over 1 petawatt hour) in July 2025.
This blows the previous one-month consumption record out of the water. 🧵
Industrial power consumption was up 4.7% YoY, rising to almost 600 TWh in the monthly of July.
Industrial sector performance continues to strengthen after weaker growth in previous months due to the tariff threat, but still a touch sluggish. Movement in the right direction tho.
Meanwhile, power consumption in the services sector was up a very strong 10.7% YoY in July to 208 TWh. I had to revise my chart's y-axis, as one-month power consumption cracked 200 TWh for the first time.
That's more than 2x the services power consumption of July 2019.
Ok, I was asked by 5+ people to weigh in, so here we go.
Quick answer: This is wrong. China currently has much more dispatchable capacity (MW) than peak load AND much more capability to generate power (MWh) than is consumed by customers, both by large margins.
At the end of 1H 2025, China had roughly 2071 GW of dispatchable capacity (thermal, hydro, nuclear, batteries).
Meanwhile, national peak load on 17 July 2025 hit a new high of 1508 GW.
Thus, reserve capacity margin during the recent annual demand peak was ~37%. That's dispatchable capacity...not counting intermittent generators. Of course, in reality, the demand peak arrived at a period when solar generators WERE available (afternoon on a sunny, hot, midsummer day). China now has over 1000 GW of solar (and 650 GW of wind). So some of them were performing at this time, but it's a good conservative practice to not include them in a reserve margin estimation.
Most of the time, load is WELL below 1508 GW and effective reserve margins are higher. In mild evenings of shoulder seasons with no particular heating or cooling demand, reserve margins are at their highest, probably over 100%(?) But in the context of considering a data center that needs to operate 24/7/365, we might as well look at the annual peak as our limiter.
Generation vs. Consumption and Surplus:
Generation and consumption will be balanced, yes (after accounting for plent self-use and line losses). But if the generators COULD generate more, then that means you have a lot of unused potential. This is the case in China.
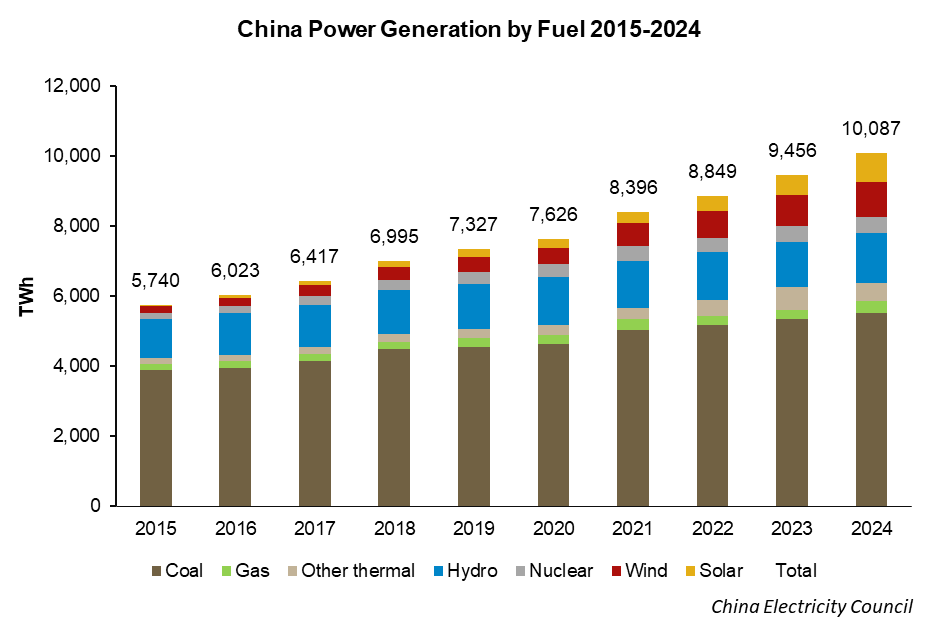
In 2024, the average annual operating numbers for China's thermal fleet of 1444 GW were just 3442 hours. That works out to an annual capacity factor of ~39% (the average is higher for coal and lower for gas). There's nothing stopping them from generating more, except the power consumption needs of the Chinese economy were already met by other generation sources.
Frankly, these thermal generators could easily generate 2x their current operating hours and it wouldn't be a problem at all (except for the carbon peaking target of course!). If the annual capacity factor of the thermal fleet doubled to a hardly-unreasonable 78%, it would yield an additional 4,970 TWh annually. That's more than the entire annual consumption of the USA.
Yes, China is squatting on an entire USA's worth of untapped power generation solely within the unused capacity of its current thermal fleet.
Additionally the curtailment of wind and solar means there are times throughout the year when these generators are producing power that the grid can't accept - thus it is wasted. National curtailment rates were around 3% last year, but much higher in individual provinces (and they've been rising in 2025).
Chongqing is once again all over my timeline, for the thousandth time, once again for a silly reason.
But why does Chongqing seem to break statistical brains?
Let's talk about it, so it becomes clearer why this place is confusing and hopefully make it easier next time.🧵
So...Chongqing is huge. It's a direct-governed municipality covering 82,000 sqkm /31,000 sqm, roughly the size of Austria or Czechia or Panama.
It has a total administrative population of 31.9 million people spread across the region, including urban, suburban, and rural areas..
Chongqing municipal authorities identify four distinct city regions:
"Core Main City Region" (red), population 10.5m
"New Main City Region" (orange), population 10.7m
"NE Three Gorges region" (green), population 8.0m
"SE Wuling Mountain region (blue), population 2.9m
"There are currently almost 20,000 men under the ground, right at this moment, all digging coal?"
Mr. Qi smiled and nodded. "Yes that's right".
In Off the Beaten Track this week, I visited a coal mine in China's famous Ordos City in Inner Mongolia. Here's what I found.🧵
The way most people have heard about Ordos, a small city in central Inner Mongolia close to Shaanxi, is to see it referred to as a "ghost city".
It's not, and it never was, but that's the unfortunate reputation (more about this topic another day).
Ordos is a major energy hub. Not does only have excellent wind and solar resources, but also (and probably most famously and importantly for its economy) Ordos sits atop massive coal deposits.
Ordos is one of the 3 key coal-producing regions of China, one of three with its own domestic price index (Ordos 5500). The other two are Yulin (Shaanxi) and Datong (Shanxi).
On our recent visit to visit energy infrastructure in Ordos with @jerometenk, I asked a Shanghai friend from Ordos who has classmates still working in the coal sector back home for some introductions.
That's how we met Mr. Qi, who runs a coal trading business there.
In June 2025, China's power consumption grew 5.4% year-on-year to 867 TWh in one month (or 867 billion kilowatt hours, as China likes to report).
This is roughly equal to June or July's monthly consumption from 2023... 🧵
Industrial power consumption rose 3.2% YoY in June, reaching 549 TWh. Still slower growth than GDP, but at least a slightly recovery vs May, which was truly poor at just 2.2% YoY growth. Looks like manufacturing is readjusting to the tariff impacts and picking up again.
Power consumption in the services sector resumed its aggressive trend as well, rising 9% YoY in June to 176 TWh.
Services portion of GDP was up 5.7% over Q2, rising faster than manufacturing, which drove a portion of this increased power usage.