Ryan Maue Profile picture
Jun 23, 2021 7 tweets 4 min read Read on X
Digging into Portland, Oregon climatology:

Highest temperature:
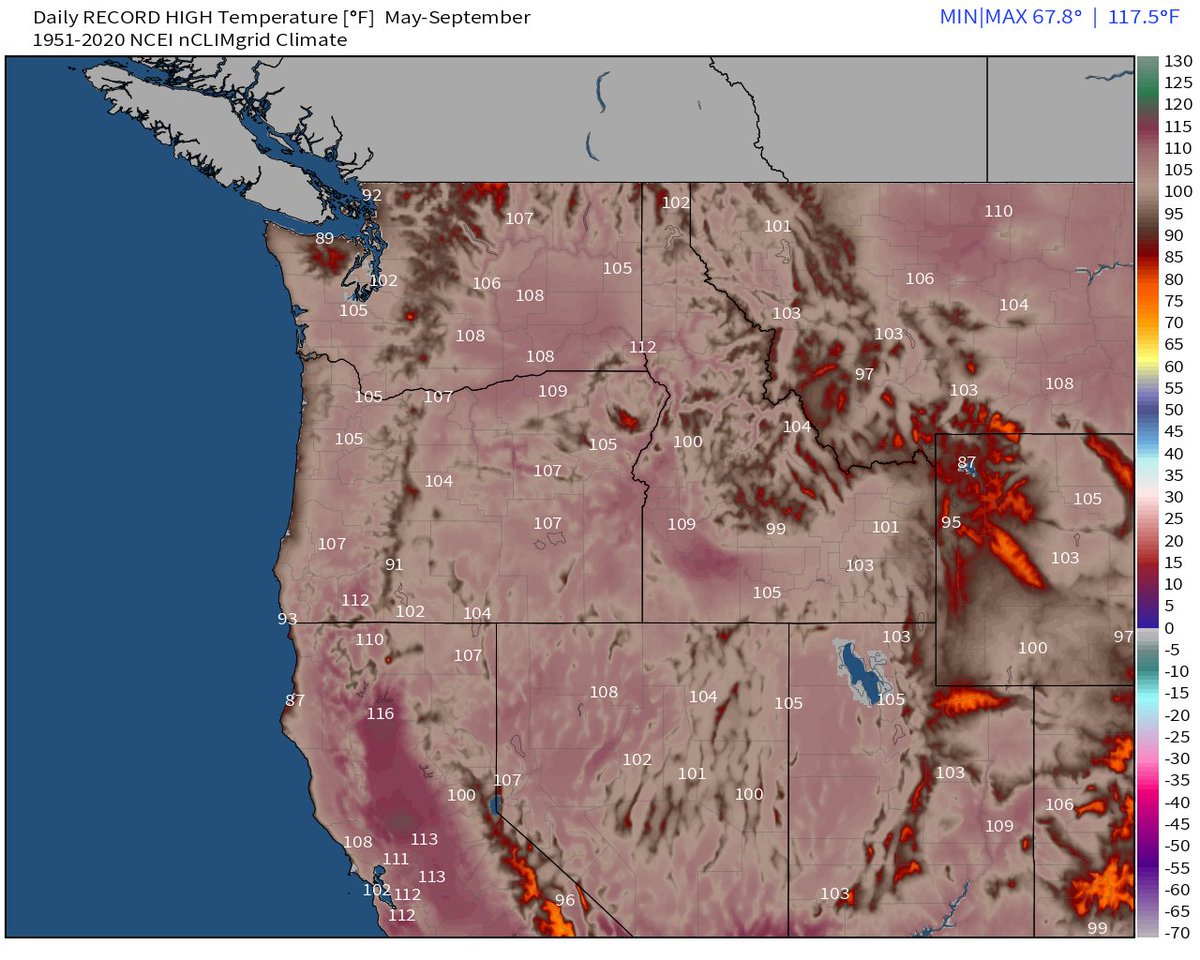
🔥107°F August 8 & 10, 1981, and July 30, 1964

🌡️106°F on July 28 & 29, 2009.

Here's a gridded daily analysis (estimate) of the highest temperatures observed from May-September 1951-2020.
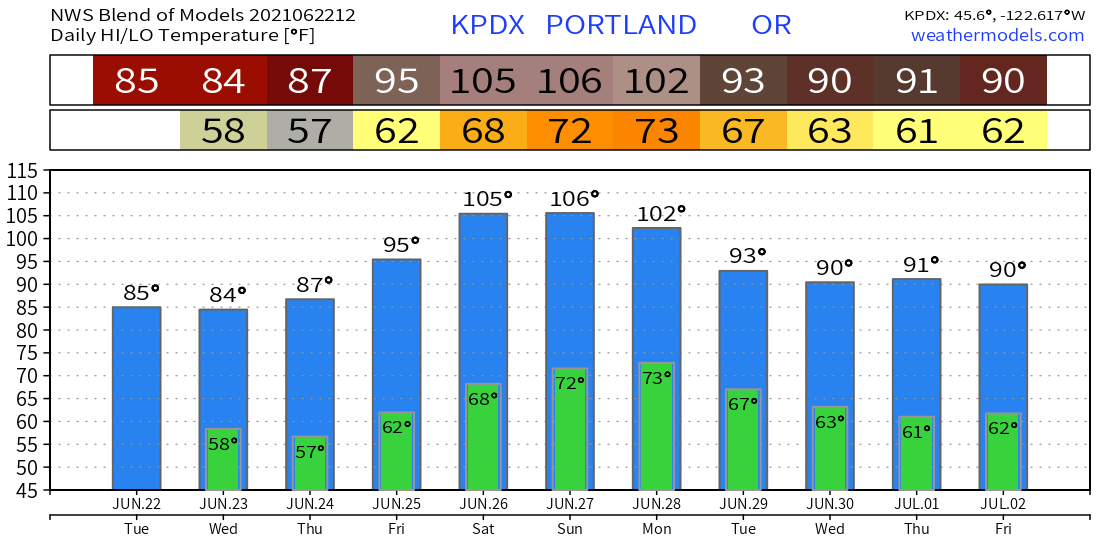
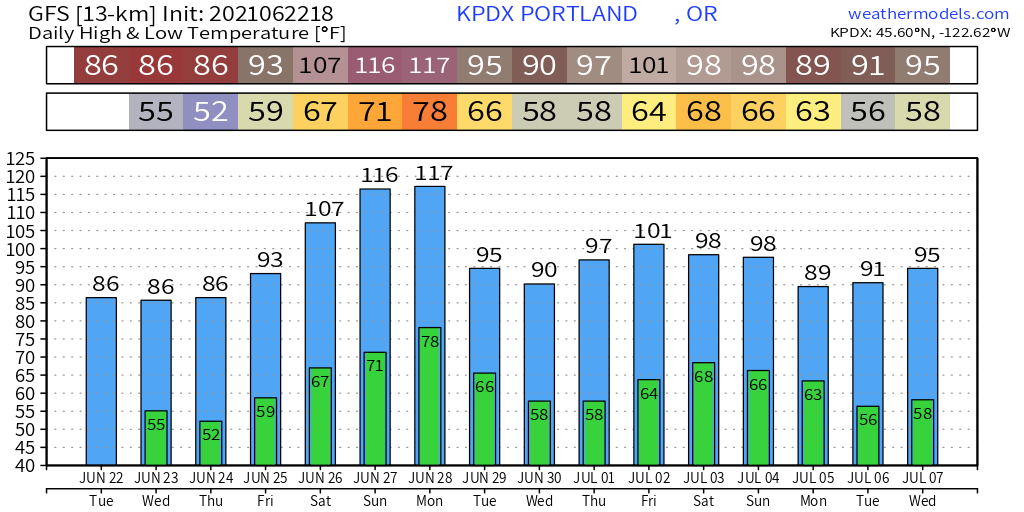
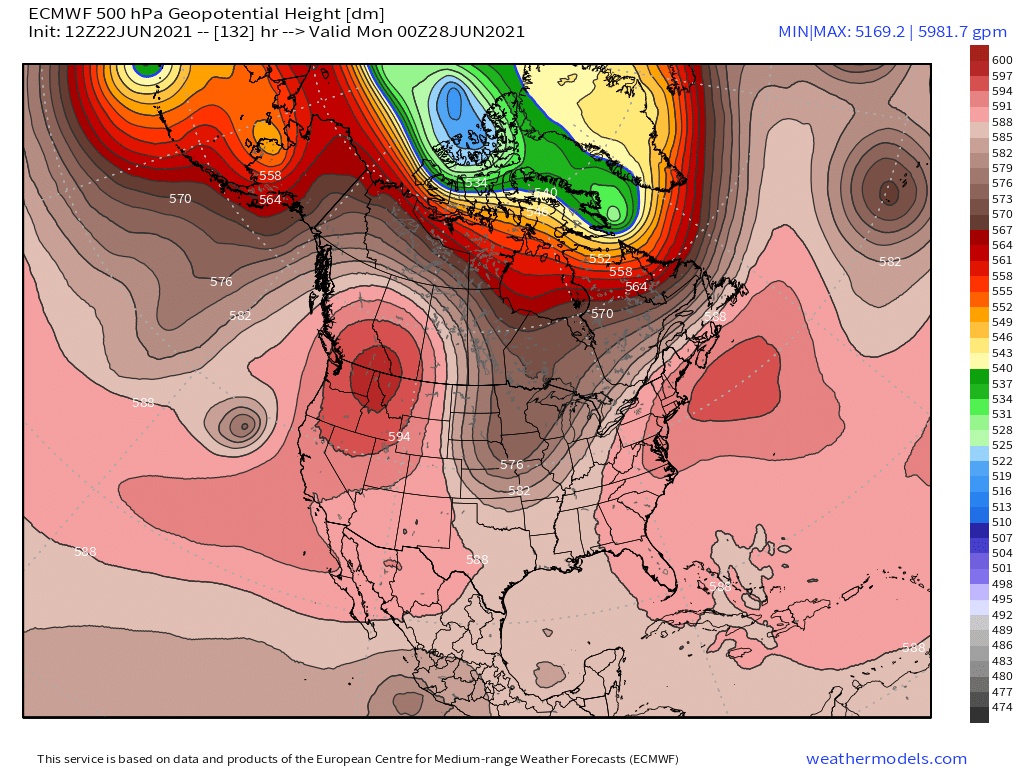
Blend of Models near the all-time record in Portland at 105°F and 106°F this weekend.

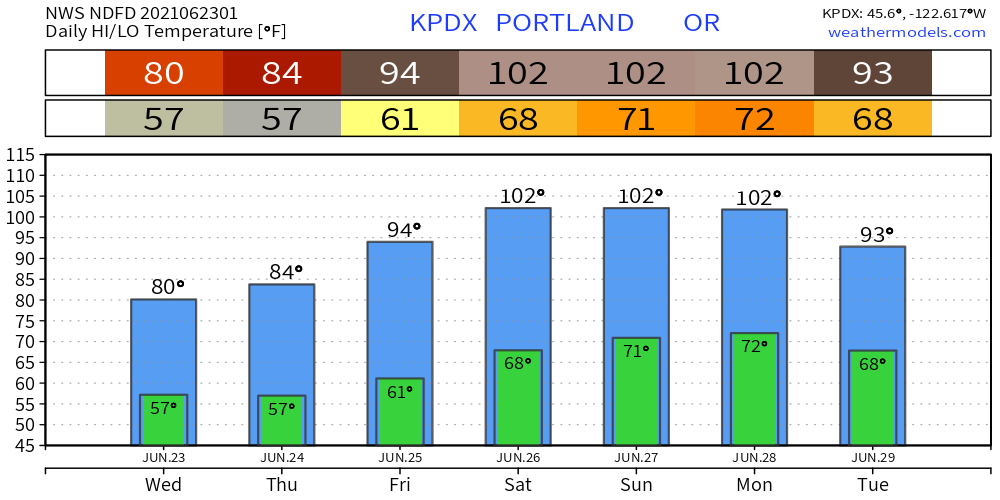
NWS Portland is at 102°F for 3-days in a row. 🌡️

Based upon forecast trends, I'd put even money on 105° and 10-20% chance of hitting the 107°F record. 🎰
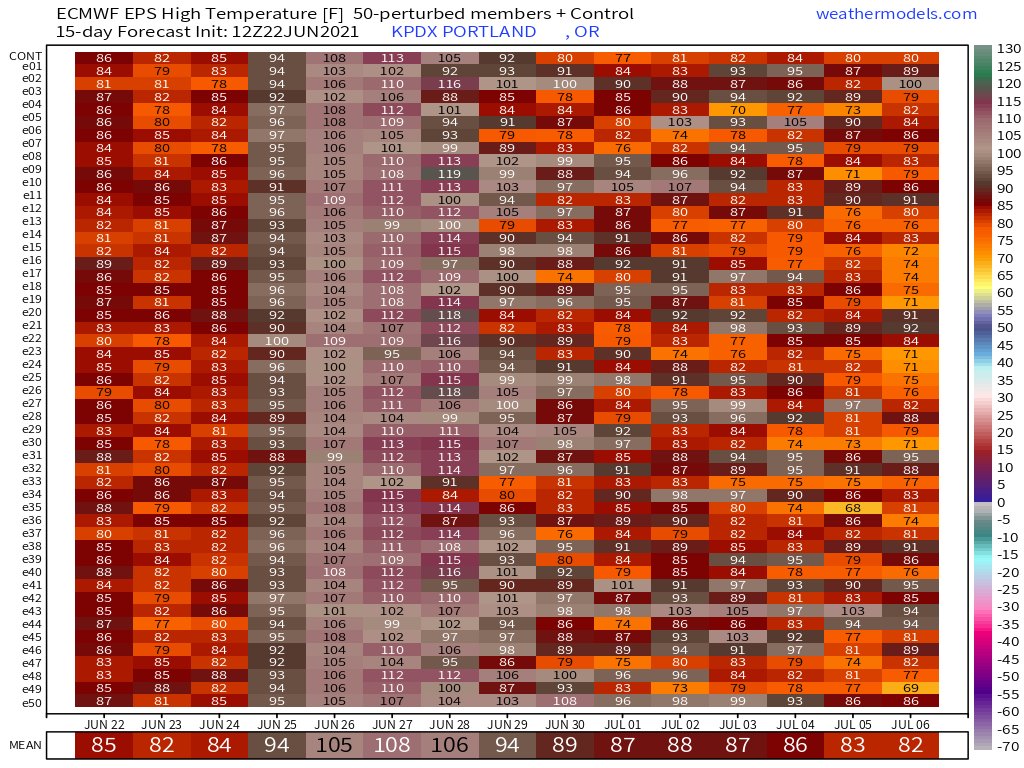
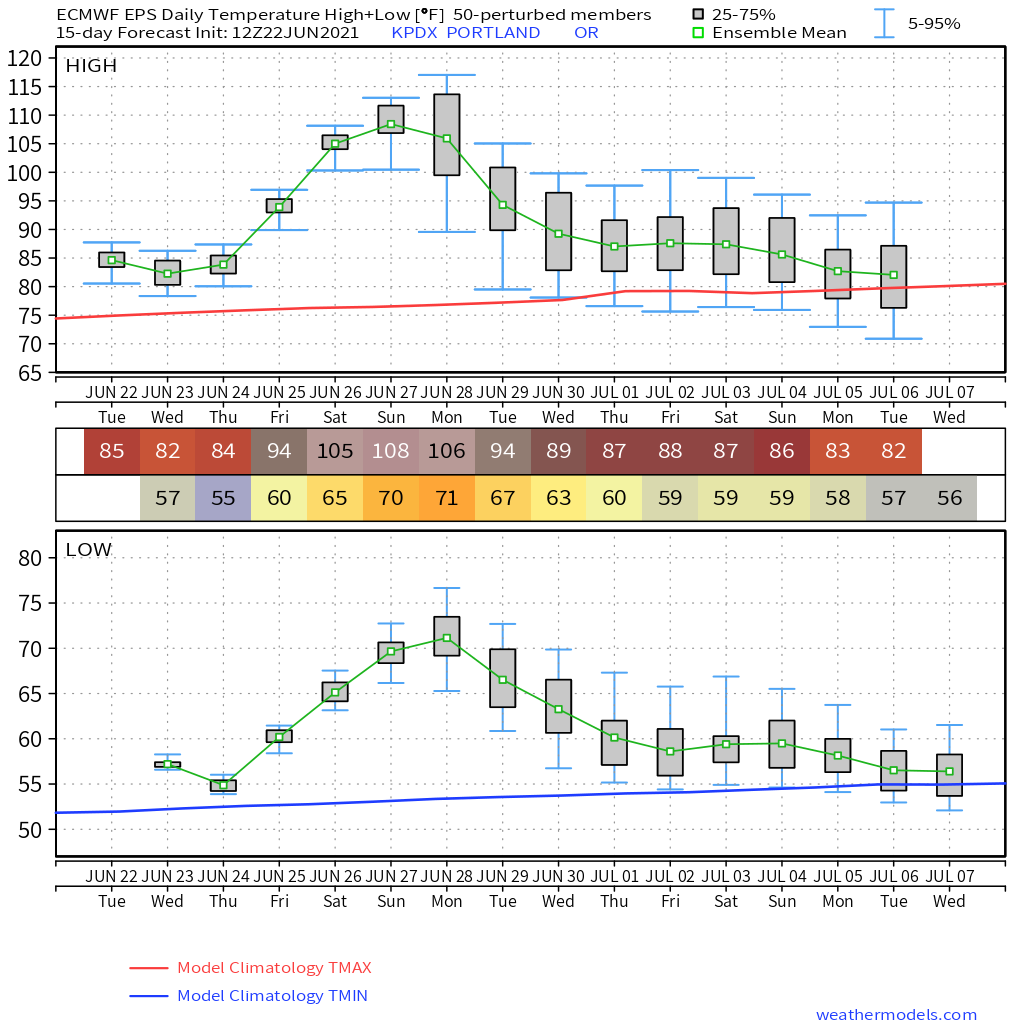
Must post the ECMWF EPS ensembles -- model has the most vertical levels & perhaps can best resolve the Columbia River dynamics. It is flaming HOT 🔥

The ensemble median is all-time record at 108°F and majority of solutions are in the 110s. This is an unprecedented forecast ♨️
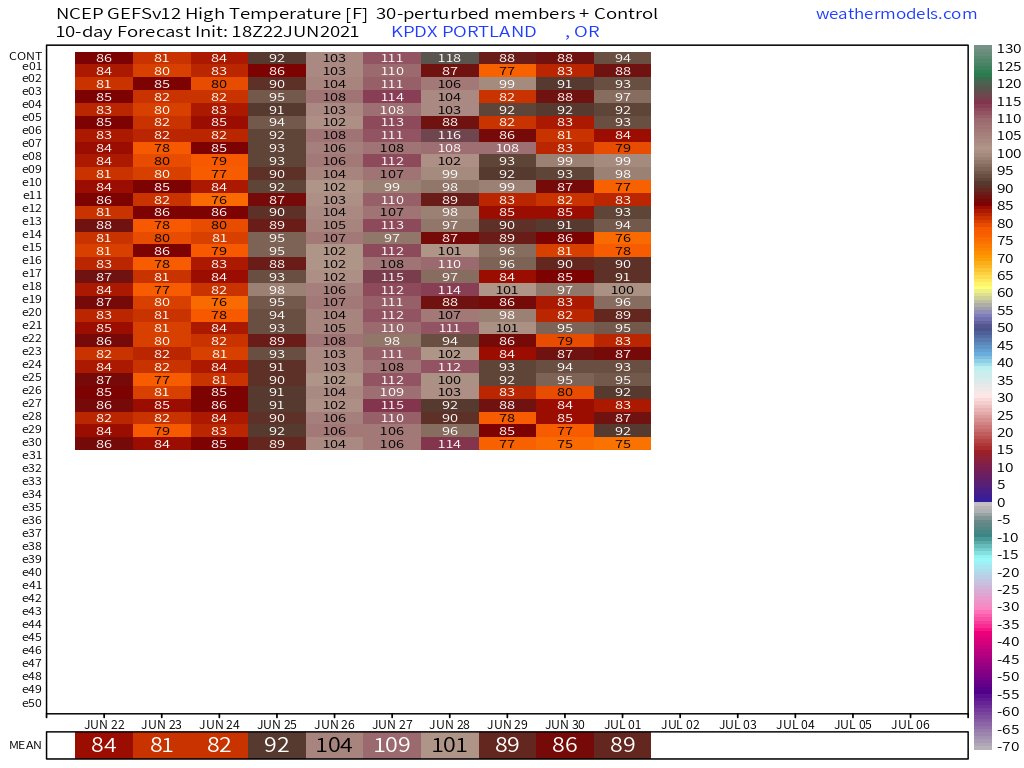
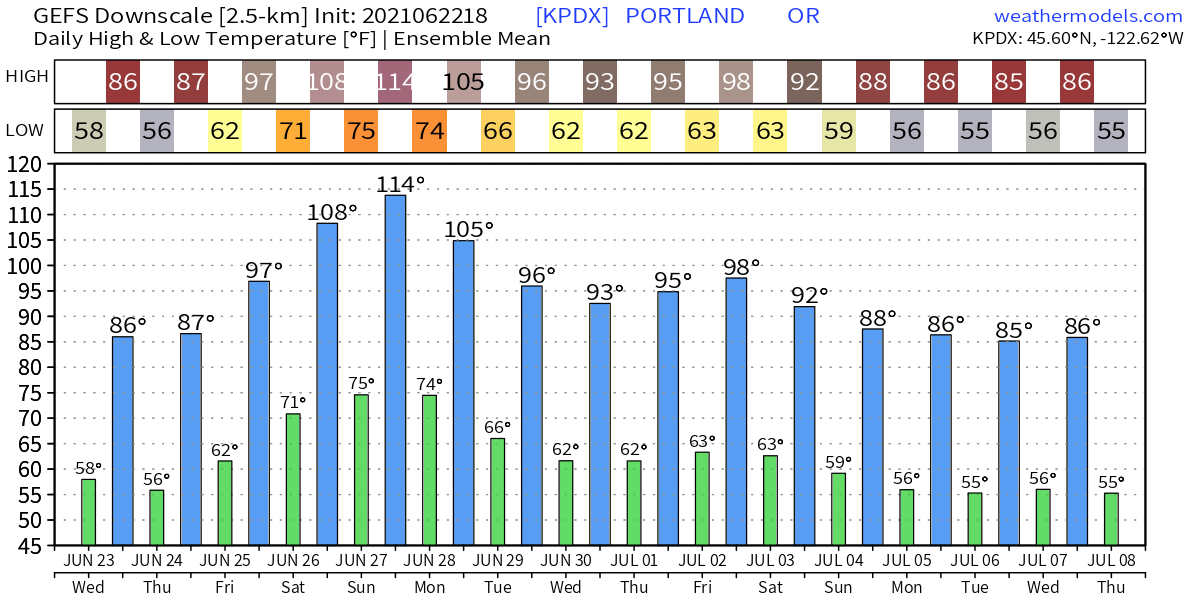
If you're shopping around for other opinions, then don't look at GFS/GEFS. Even hotter, with the downscale solution median at 114°F in Portland. 🌡️🔥

Patiently waiting for these forecast model solutions to back off -- give up -- and cool off. Not tonight.⌚️
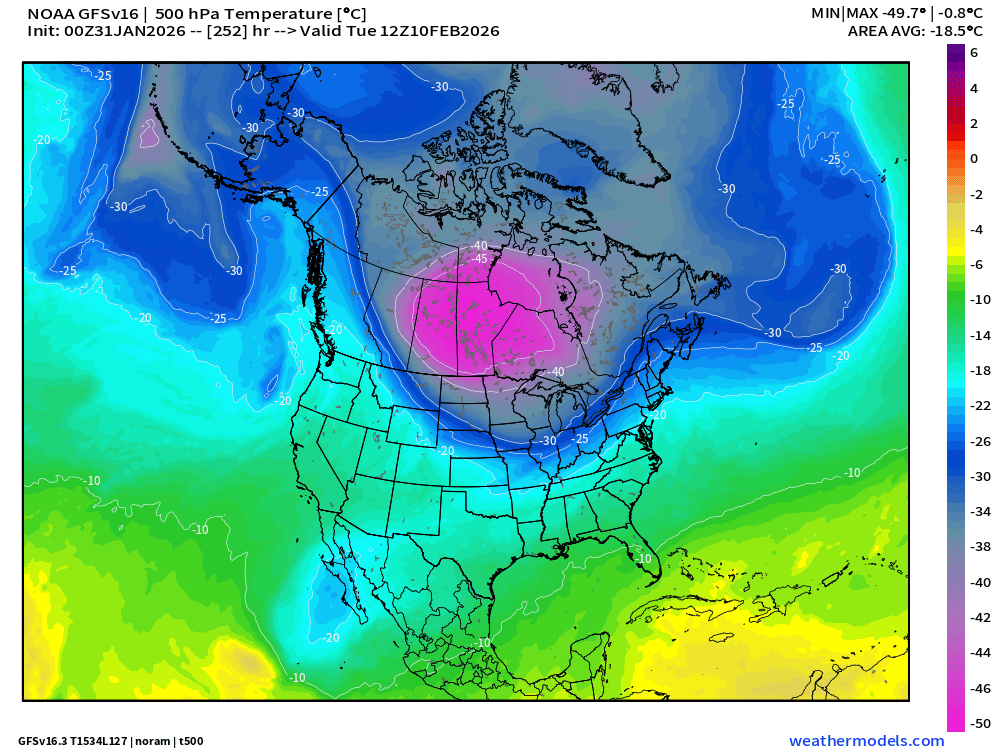
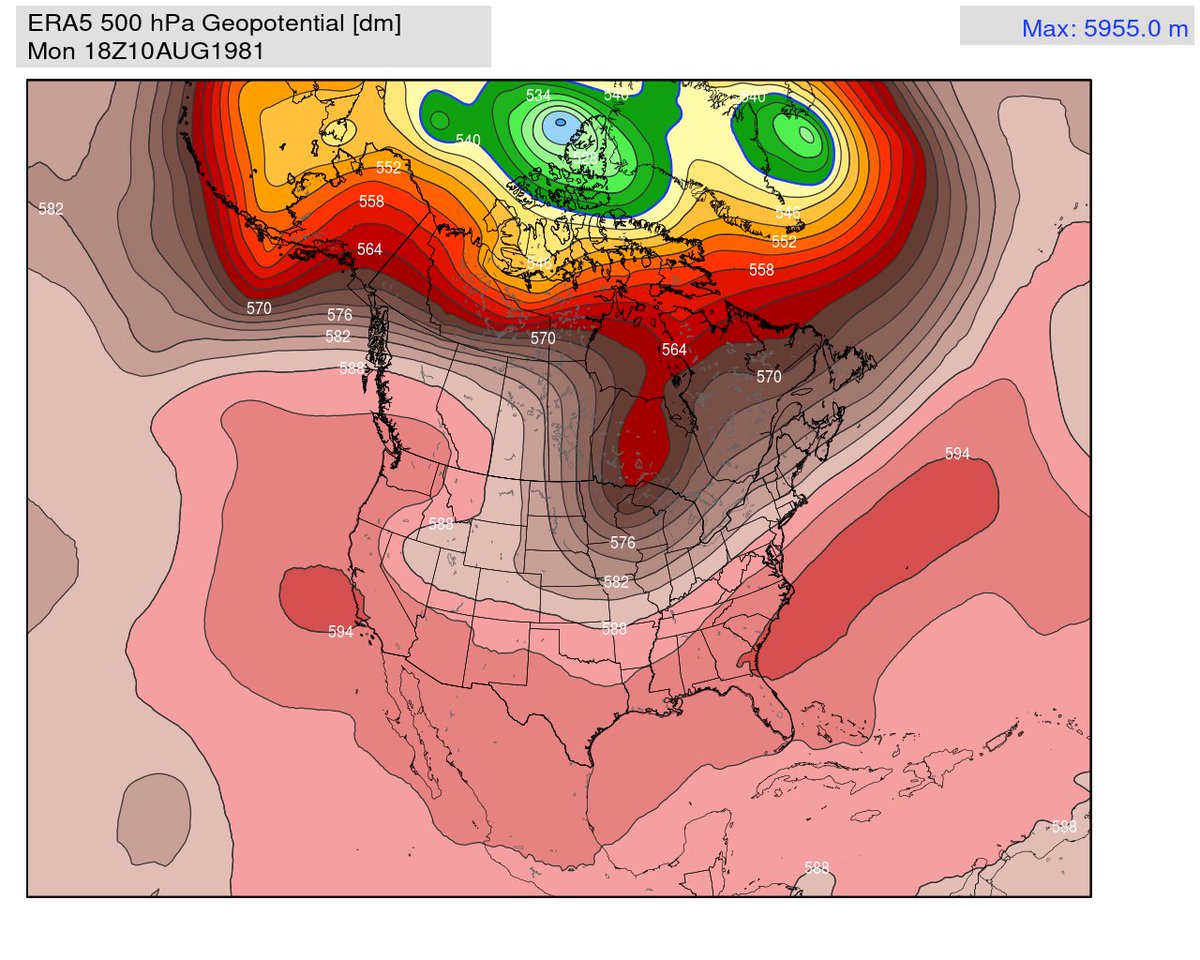
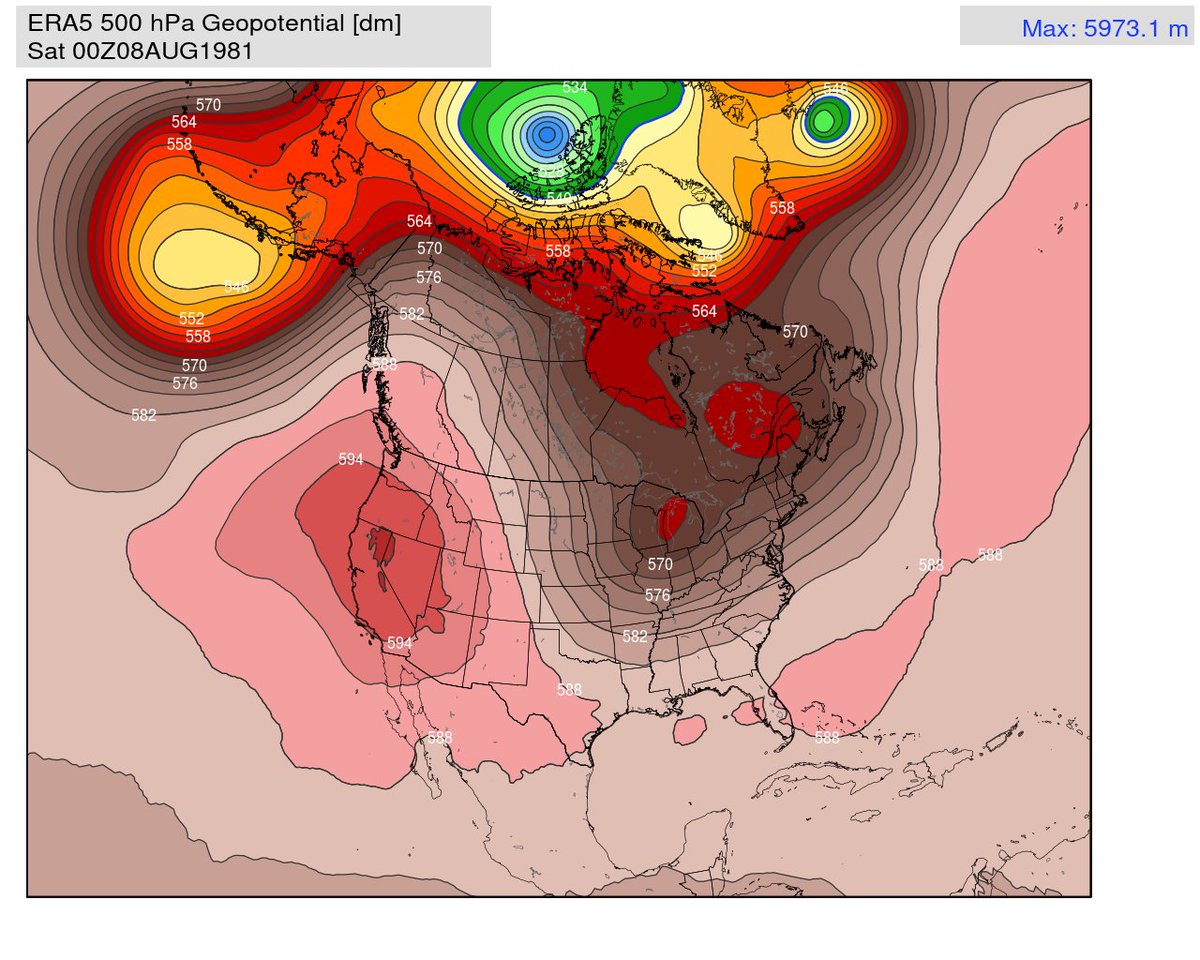
Going back to August 1981 to look at the mid-level height pattern at 500 hPa. Not too shabby 597 dm ridge centered over Redding California.

Weekend has > 597 dm "heat dome" centered much further north in eastern Washington, almost into Canada. Certainly a different beast.
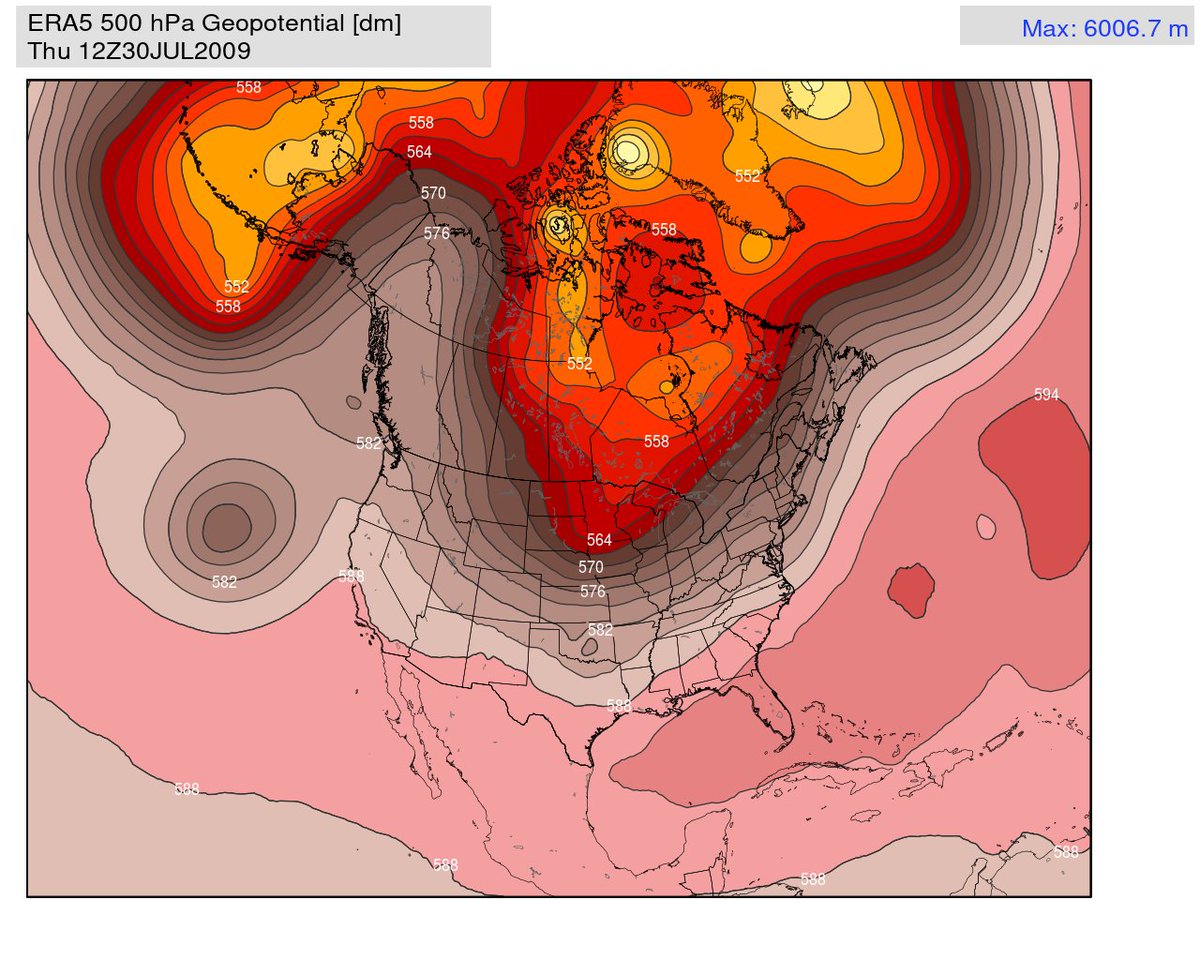
Height field from July 29, 2009 when Portland when to 106°F on the 28th and 29th. Ridge axis extends north into the Arctic Ocean. A cut-off low is off the California coast.

Have to say that I'm now leaning more into the all-time record being shattered at PDX.

Keep 👀🌡️
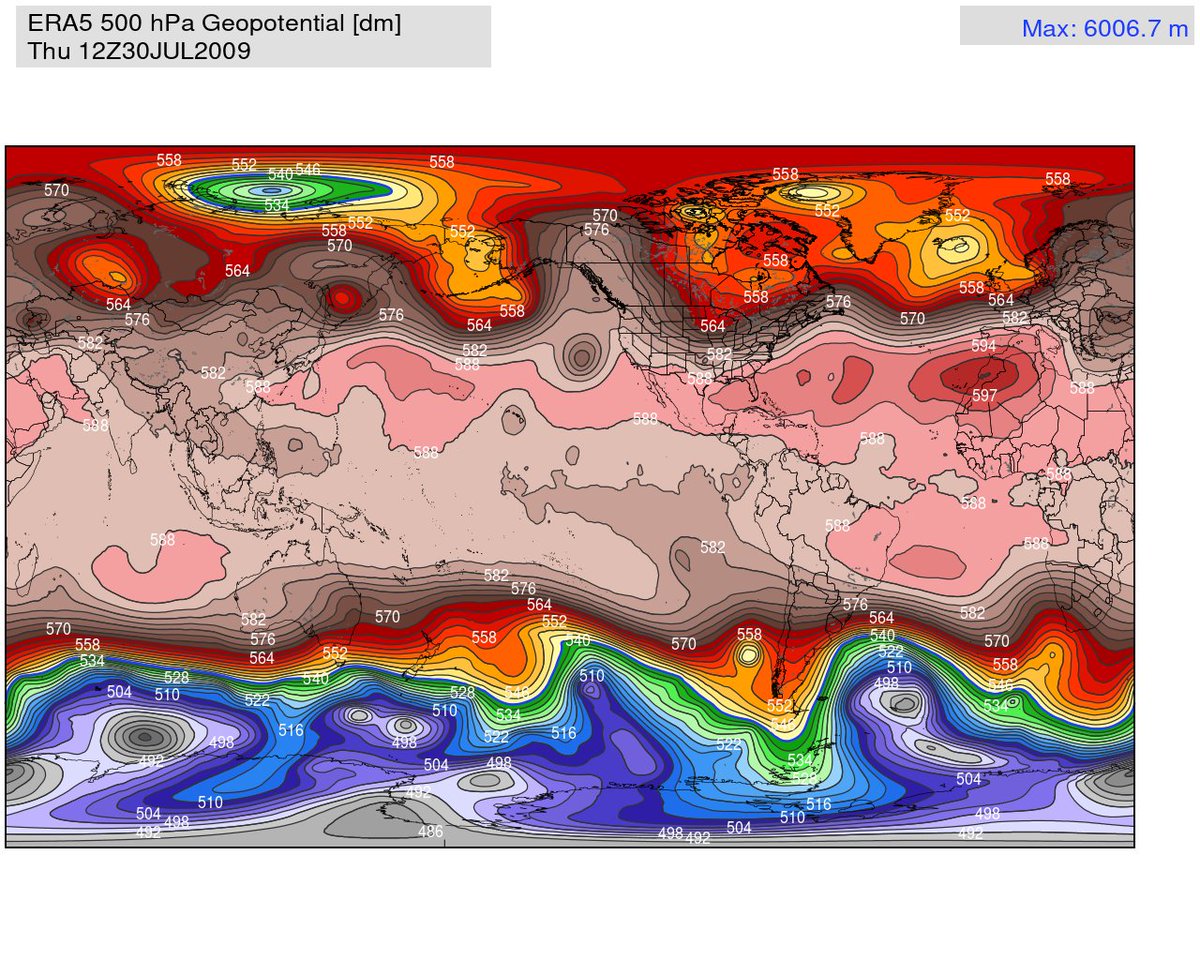
The max stat caught my eye -- 601 dm ridge over Morocco on July 30, 2009.
I'd suppose it was extremely hot under that.

• • •

Missing some Tweet in this thread? You can try to force a refresh
 

Keep Current with Ryan Maue

Ryan Maue Profile picture

Stay in touch and get notified when new unrolls are available from this author!

Read all threads

This Thread may be Removed Anytime!

PDF

Twitter may remove this content at anytime! Save it as PDF for later use!

Try unrolling a thread yourself!

how to unroll video
  1. Follow @ThreadReaderApp to mention us!

  2. From a Twitter thread mention us with a keyword "unroll"
@threadreaderapp unroll

Practice here first or read more on our help page!

More from @RyanMaue

Jan 31
Remember I was talking about the "Final Boss" of Arctic blasts? NOAA GFS 00z 👀 Obviously, historic cold potential. Image
Image
Just pay attention to the "potential" down the road -- by Feb 10th or so, matching the coupling of the stratospheric polar vortex stretching with the troposphere below.

Predictability is very high right now through 10-days > 0.8 with high latitude blocking. Into Day 13 Image
And, with that PV tail dragging through Texas, would mean potential for explosive cyclogenesis along the Gulf Coast or off Southeast coast. This would be a complete rewrite of history books from a 990 mb blizzard over Pensacola.

40-50 years since we've even approached this weather pattern plausibilityImage
Read 6 tweets
Jan 20
Evening update: I don't think people appreciate what's coming to Texas --> Southeast and the Carolinas over the next 10-12 days. Hide the women and children.

Some of the model solutions are historic / catastrophic and previously thought impossible.
We can handle snowfall -- mostly.

Next 6-days: large area of 12-18" stretches from Oklahoma to the Carolinas along Interstate 40 through Nashville.

This "battle ground" may adjust north/south.

Temperatures will not be warming anytime soon so this snow will remain on ground.
What we can't handle is "heavy freezing rain" and ice accumulation south of this "snow zone"

Boatloads of subtropical moisture out of the Pacific + Gulf of Mexico will overrun Arctic air in the 20s (°F) and fall through it --> Saturday into Sunday.
Read 4 tweets
Jan 4
Climate chaos helped spark the French Revolution --> and another massive "oozing" eruption of a flood volcano like Laki in Iceland could greatly disrupt European society today.

The "Greenhouse" Summer of 1783 featured a toxic sulfuric acid cloud over England and Europe. Image
The Northern Hemisphere winter of 1783-84 was brutally cold as the sulfuric aerosol veil formed in the stratosphere.

122 megatons (Mt) SO2 was erupted into the atmosphere by Laki 🌋with perhaps 100 Mt reaching the upper-atmosphere.

agupubs.onlinelibrary.wiley.com/doi/10.1029/20…Image
The Volcanic Spark of Revolution

After a series of failed harvests and the 1788 hail storms that destroyed crops, French peasants hungry for bread stormed the Bastille in 1789.

Climate links --> the Laki fissure eruption helped spark the French Revolution.Image
Read 4 tweets
Oct 31, 2025
Climate change attribution of Hurricane Melissa.

I'm sure you've seen headlines like this: 'Climate Change Made Hurricane Melissa Four Times More likely'

But what does this mean? You'll be surprised to learn -- "not much" for this particular event -- or really any event. Image
First, we do not have counterfactual Earths to compare what might have happened had humans not industrialized in the late 1700s. In that world, hurricanes, typhoons, or cyclones caused enormous loss of life due to lack of warning, 18th Century infrastructure, and inability to evacuate quickly.

Second, Jamaica and the rest of the Atlantic basin have experienced devastating hurricanes of major (Cat 3) to Cat 5 intensity especially during colder decades of the Little Ice Age. Paleotempestology research shows MORE tropical cyclones during colder centuries.

Jamaica's written history shows disastrous hurricanes in 1722, 1744, 1780, etc. but before barometers, we can only rely upon news reports, and possibly proxy evidence like silt.

Thus, our task is to determine how a hurricane prior to industrialization or during the 18th Century would have behaved in a similar circumstance as Melissa.

While climate models are typically used to produce counterfactual Earths, they are not particularly reliable for tropical cyclones and have highly uncertain outcomes for the past, present, and future!
For floods in the U.S. and elsewhere, catastrophe models are built to understand the recurrence intervals of extreme events. Hence, we need as much historical data as possible -- as far back in time. That's mainly dependent upon inhabitation by people.

In Europe, we have detailed river level levels back to the 1600s, and can use hundreds of years of records to determine if an event was unprecedented, and provide a more accurate Return Period (RP).

But for hurricanes in the Atlantic, that is not the case. While we have mostly complete records for hurricanes while making landfall -- especially in populated areas -- we have to infer (guess) existence, tracks, and intensity of storms in the open ocean away from shipping lanes, and later in the 1940s and 1950s, outside aircraft observations.

Even then, our records are only "pretty good" when satellites came online in the 1960s with improving quality and coverage in the late 1970s.

Today, we have 1-minute updates at 1-kilometer resolution from GOES-19 geostationary satellite + frequent aircraft sampling. However, even with all of our fancy tools, the hurricane is constantly fluctuating and measurements 15-minutes ago could be not longer representative of the present situation.
Read 12 tweets
May 29, 2025
Frivolous lawsuit ...

But excellent test for climate attribution pseudoscience in the courtroom.

NY Times fails to mention that the car's air conditioner broke, and weather forecasts clearly detailed the day's high temperatures. Image
Image
The research study that concluded this heat wave event was "virtually impossible" without climate change does not provide an analysis of all "heat dome" events from the past 2,000 years -- instead focusing on model data since 1950.

esd.copernicus.org/articles/13/16…
Just imagine if this type of lawsuit succeeded.

Modern-day witchcraft trials.

apnews.com/article/climat…Image
Image
Read 7 tweets
May 11, 2025
Volcanic Eruption Of 1600 Caused Global Disruption

🌋425 years ago, a massive eruption of Huaynaputina in Peru caused worldwide impacts including worst Russian famine in history from 1601-1603.

30% of Russia's population died Image
Huaynaputina erupted in 1600 and has since gone quiet.

The VEI 6 eruption in 1600 was exceptionally severe for global climate cooling the globe because of 2 other strong eruptions in previous 15-years.

en.wikipedia.org/wiki/Huaynaput…Image
Image
"The summer of 1601 was among the coldest in the Northern Hemisphere during the last six centuries, and the impact may have been comparable to that of the 1815 Tambora, 1452/1453 mystery eruption, 1257 Samalas and 536 mystery eruptions."

214 years from Huaynaputina --> Tambora
We are 210 years since Tambora.
Read 5 tweets

Did Thread Reader help you today?

Support us! We are indie developers!


This site is made by just two indie developers on a laptop doing marketing, support and development! Read more about the story.

Become a Premium Member ($3/month or $30/year) and get exclusive features!

Become Premium

Don't want to be a Premium member but still want to support us?

Make a small donation by buying us coffee ($5) or help with server cost ($10)

Donate via Paypal

Or Donate anonymously using crypto!

Ethereum

0xfe58350B80634f60Fa6Dc149a72b4DFbc17D341E copy

Bitcoin

3ATGMxNzCUFzxpMCHL5sWSt4DVtS8UqXpi copy

Thank you for your support!

Follow Us!

:(