John Roberts Profile picture
Jun 25, 2021 9 tweets 4 min read Read on X
The latest PHE surveillance report on Delta is now out. A flash summary on some key points.

The analysis of cases/admissions/deaths now helpfully includes an age split at 50. Of 109 deaths over 50, 38 were unvaccinated (a third), yet represent ~5% of that population.

1/ Image
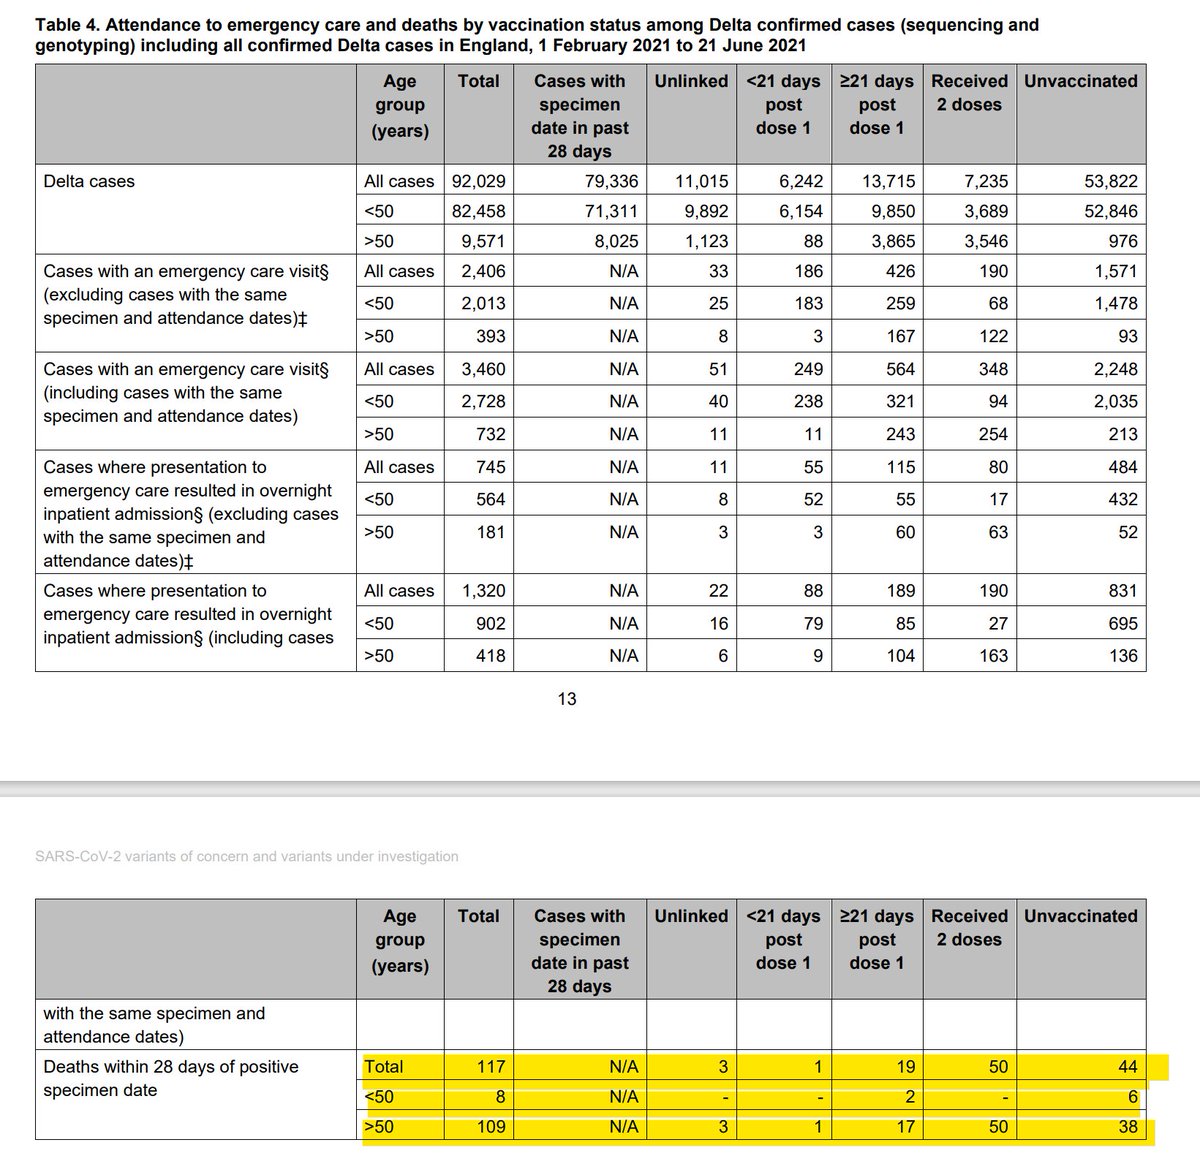
Nevertheless 50 who died had received both jabs. Remember though that no vaccine is 100% effective, and the risk factors are many times higher in the fully vac'd group because of the priority ordering.

This recent note explains in more detail.

2/
In the last couple of weeks for which data is available, there seems to have been a big increase in the proportion of cases via hospitality, consistent with the reopening of indoor venues in mid May. Education setting fell with half terms.

3/ Image
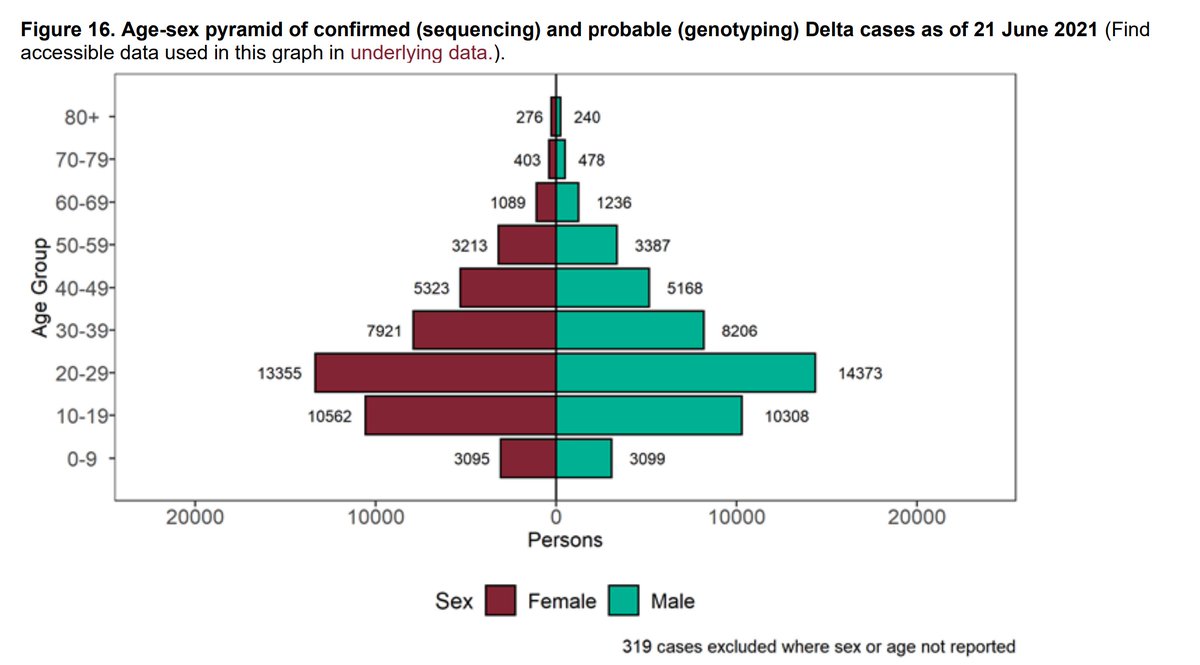
You can see here how the growth in Delta has been predominately in the under 30s groups, whom are only now going through the first stage of the vaccination programme. Even allowing for lower population numbers, there's much less prevalence at older ages.
4/ Image
There's been a slight increase in the estimate of first dose effectiveness against symptomatic disease, but it's still only 35%. Against two doses it stays around 80%, but that's still twice the level of escape as for Alpha.

5/ Image
In contrast, against hospitalisation there's no evidence (given the CIs) that it is any more or less effective than against Alpha, and after 2 doses is 96%.

So having that 2nd dose reduces vaccine escape from 20% to 4%, an 80% reduction is risk. You know it makes sense!

6/ Image
The secondary attack rate comparison with Alpha has fallen this week to 35% (from 42%) as the estimate is refined with more data. That's more encouraging news. The absolute figure has fallen too from 11.4% to 10.7%.

7/ Image
Thanks as always to the terrific team at PHE for producing this huge volume of data like clockwork each week, and for continuing to enhance the information in it.
assets.publishing.service.gov.uk/government/upl…
8/8
Note also this interesting thread from @JamesWard73 regarding the inter-relationship between SAR for household and non-household contacts.

• • •

Missing some Tweet in this thread? You can try to force a refresh
 

Keep Current with John Roberts

John Roberts Profile picture

Stay in touch and get notified when new unrolls are available from this author!

Read all threads

This Thread may be Removed Anytime!

PDF

Twitter may remove this content at anytime! Save it as PDF for later use!

Try unrolling a thread yourself!

how to unroll video
  1. Follow @ThreadReaderApp to mention us!

  2. From a Twitter thread mention us with a keyword "unroll"
@threadreaderapp unroll

Practice here first or read more on our help page!

More from @john_actuary

Mar 15
A great thread on the state pension and National Insurance.

For me, the trailed abolition of NI and thus its replacement by general taxation in terms of funding state pension benefits will have a major generational redistribution of tax.

1/
It’s been the case that (in aggregate) at any one time the working generation funds the SPs of the retired generation above it.

2/
If the abolition of NI results in an increase (albeit smaller - else why bother) in income tax, whilst those in work will in total be better off, pensioners will be worse off.

3/
Read 9 tweets
Feb 7
The Pensions & Lifetime Savings Association has updated its guide to living costs in retirement. The full report is well worth a read, and goes into a lot of detail.

1/

retirementlivingstandards.org.uk/2023_research_…
Image
One key point is that it assumes that pensioners own their home outright - probably reasonable now, but the shift to renting means that in future years that may become increasingly questionable.

2/
It focuses on retirement income, but note that other sources may be used to fund retirement, whether it be income from savings/investments, or gradual withdrawal of capital. Much more likely to be relevant for those aspiring to a comfortable lifestyle of course.

3/
Read 7 tweets
Dec 21, 2023
UKHSA estimates that prevalence of COVID in England and Scotland has nearly tripled in the month since the ONS restarted its COVID infection surveillance.

1/

gov.uk/government/sta…
Image
Fortunately prevalence is lowest at the oldest, more vulnerable age groups, but is estimated at just under 6% in the 18 to 44 age groups.

2/ Image
Prevalence is estimated to be highest in the London area, at just over 6% across the population. Note though that confidence intervals are wider due to lower sample sizes than in previous studies.

3/ Image
Read 4 tweets
Sep 12, 2023
So with the news this morning that the earnings growth announced today means the state pension (SP) will very likely increase by another 8.5% next year, it's time to set out once again why the SP triple lock (TL) is such a bad idea.

1/ Image
It's all down to cherry-picking the best of the three rates each year. I did a thread nearly a year ago, that hopefully sets out clearly how the mechanism inevitably means that the SP will grow over time against both earnings (E) and prices (P).

2/
Visually, you can easily see how that cherry picking works in practice with this great chart from the FT.

The effect is greatest when one index lags the other by a large amount in one year, and then catches up in the next year.

3/ Image
Read 17 tweets
May 31, 2023
With BH's still distorting individual weeks' figures, the cumulative position gives a better view, with the latest CMI age-standardised analysis showing mortality 3.8% (of a full year's mortality) worse than its reference year of 2019.

1/
That 3.8% of a full year's mortality translates to an excess of 9.3% of YTD expected mortality, or over 21,000 excess deaths.

Bear in mind that pre-pandemic, you'd expect mortality 4 years later to be noticeably lower, due to the previous improving trend.

2/
The 9.3% excess is split 50/50 into "with COVID" deaths (where it was listed as a contributory factor on the death cert), and others.

Over 10,500 registrations in 2023 have had COVID listed as a cause - around two thirds of which it's put as the underlying factor.

3/
Read 5 tweets
May 13, 2023
A great example of how @ABridgen will RT any old rubbish, despite how absurd the numbers look, if they fit the anti-vax narrative he is now pursuing.

Even the original poster has now admitted that the figures were completely wrong and deleted the post.

1/
Here's the mea culpa - it was only wrong by a factor of 13, but at least the post has been deleted rather than just corrected and left up, when experience shows that only a fraction of the original audience will see the correction.

So what are the true numbers?

2/ Image
In E&W the peak week in 2020 was just under 9,000, and the second wave peak was pretty close to that number.

In total ONS has recorded 199,728 COVID related deaths in E&W since the pandemic started.

3/ Image
Read 8 tweets

Did Thread Reader help you today?

Support us! We are indie developers!


This site is made by just two indie developers on a laptop doing marketing, support and development! Read more about the story.

Become a Premium Member ($3/month or $30/year) and get exclusive features!

Become Premium

Don't want to be a Premium member but still want to support us?

Make a small donation by buying us coffee ($5) or help with server cost ($10)

Donate via Paypal

Or Donate anonymously using crypto!

Ethereum

0xfe58350B80634f60Fa6Dc149a72b4DFbc17D341E copy

Bitcoin

3ATGMxNzCUFzxpMCHL5sWSt4DVtS8UqXpi copy

Thank you for your support!

Follow Us!

:(