
Actuary for far too many years. Welsh, but now live in the spiritual home of the Wurzels out west. Don’t think I’ve got the accent yet. Like zider though...
 One key point is that it assumes that pensioners own their home outright - probably reasonable now, but the shift to renting means that in future years that may become increasingly questionable.
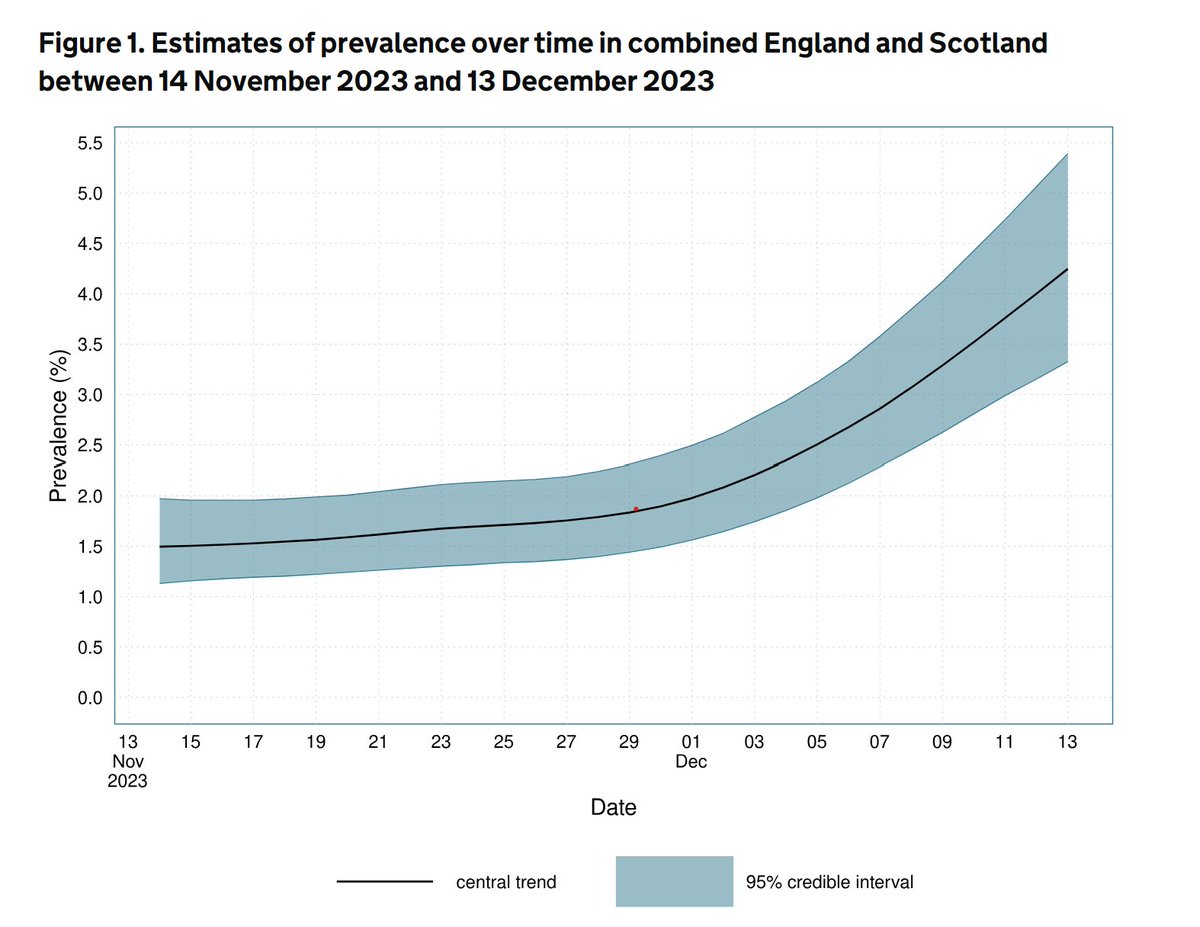 Fortunately prevalence is lowest at the oldest, more vulnerable age groups, but is estimated at just under 6% in the 18 to 44 age groups.
 It's all down to cherry-picking the best of the three rates each year. I did a thread nearly a year ago, that hopefully sets out clearly how the mechanism inevitably means that the SP will grow over time against both earnings (E) and prices (P).

 That average will include people currently in poor health, and with very limited life expectancy. With no indication the King's health is other than good for his age, that will shift the curve more to the right.
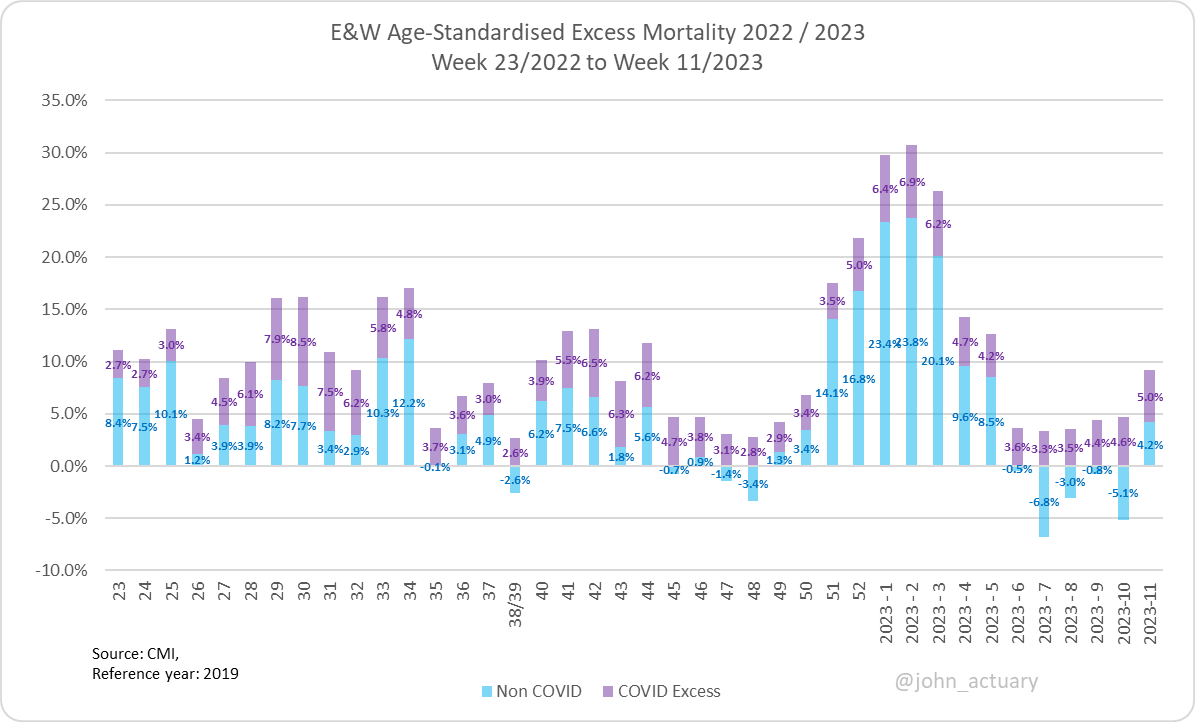 Highlighting the non-COVID related excess, after 5 weeks of a negative excess, it's back the wrong side of the x-axis. You can see the volatility though, and it's nowhere near the start of the year situation.
 Most concerning is the trend in the Over 70s, where by the final date the estimate is 4%, or 1 in 25 of that cohort. There's no apparent sign of it slowing, and whilst the last few days are always more unreliable, we won't be able to find out how accurate it is next week.
 Here's the bigger picture - the latest wave appears to be flattening off at the lowest Omicron level yet (but note more recent hospital data has picked up again).
 Deaths were still a little raised this week in 2019 due to a flu spike, so the last couple of weeks are probably a little flattering to the underlying picture.
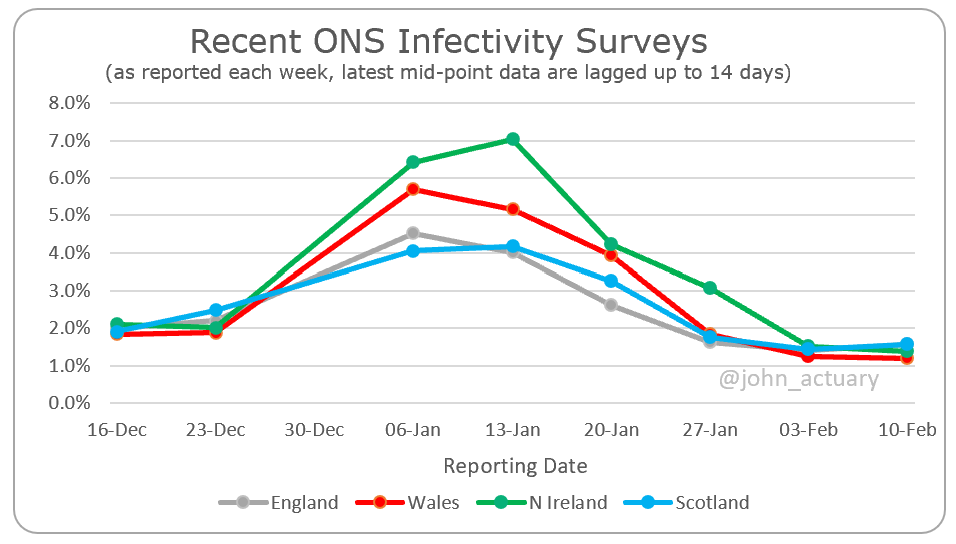
 The recent increase can be seen in the context of previous waves - note levels appear never to go below 1%, but there's a broad pattern of peaks lessening, which hopefully this wave will continue.
 A clearer view of the drift up in England here, using the ONS daily estimates, which show it topping 2% on the most recent day studied (7th Feb).
 Just for clarity, here's the "non-COVID" element of the excess, ie stripping out deaths where COVID was mentioned as a contributory cause on the death cert.
 You can see the gentle rise in England's prevalence in late January better here - remember though that modelling the last few days is more difficult, so the data can often be restated in subsequent weeks.
 But you can see here how overall ICU activity has continued to be above historic levels through the summer, driven by COVID related activity. And is on the increase again even before we get to the autumn.
 In 🏴the modelling suggests a quickening in the rate of growth, up from 24% to 32% in the most recent 7 day periods up to 24th Sep, which is the latest day estimated.
 As @ActuarybyDay notes here, excess mortality in 2022 now stands at over 15,000, despite being at -2,000 at the end of Q1. Quite some turnaround.