The housing market in a nutshell over the last fifty years? House prices up; interest rates down (although mortgage terms and loan-to-value ratios have changed a bit too).
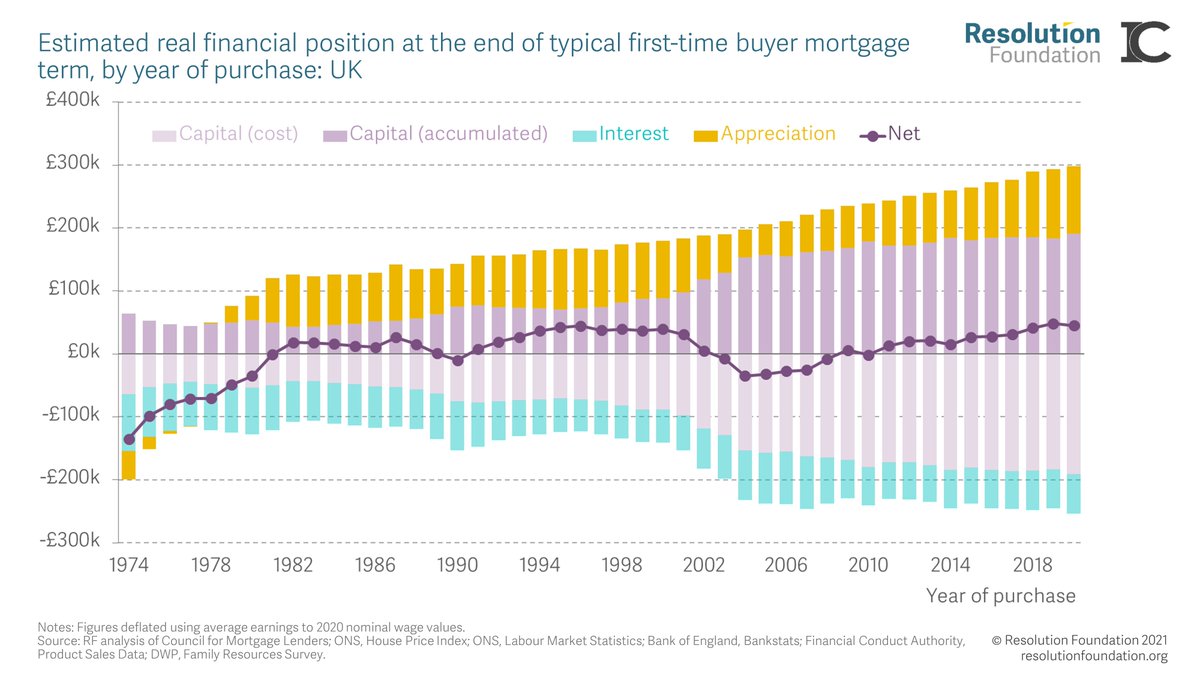
Sky-high interest rates in the 1970s, 1980s and early 1990s meant that older generations had a stressful time, especially in the early years of a mortgage...
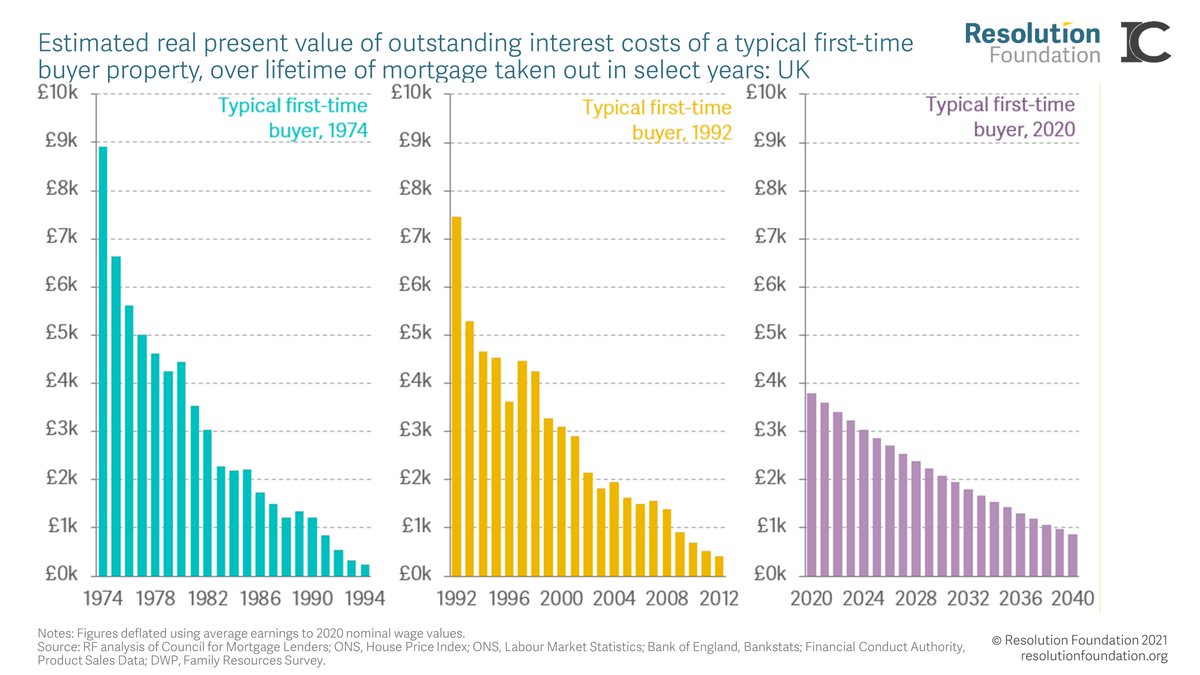
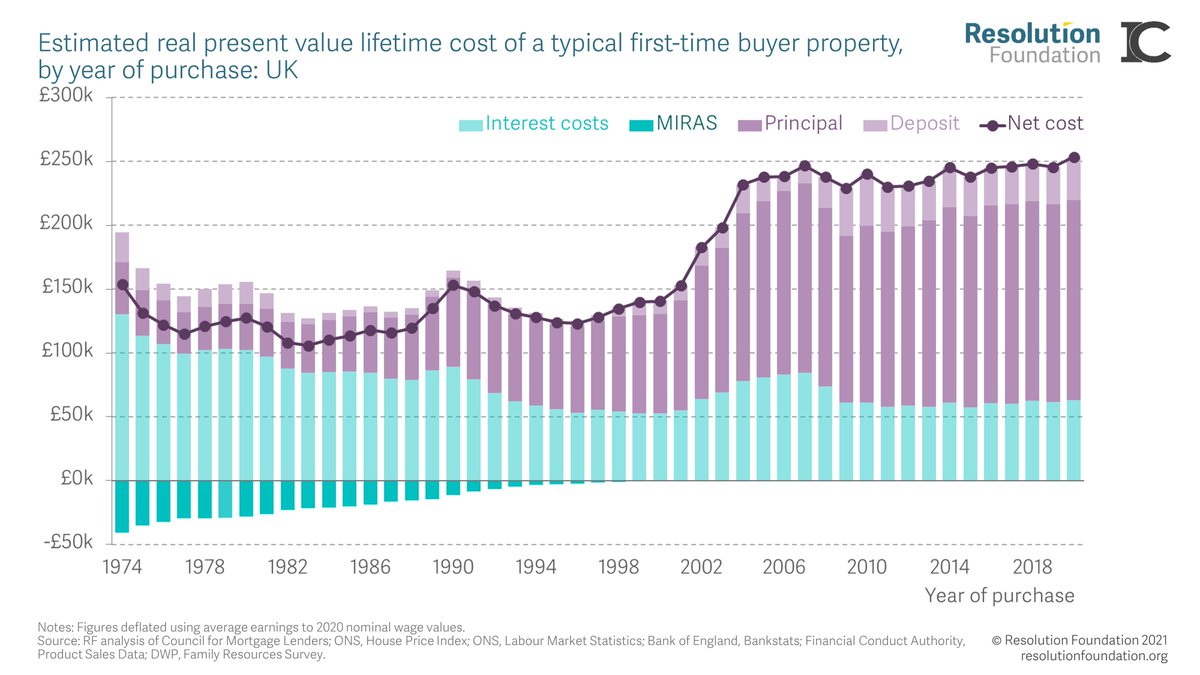
Over the course of their first mortgage term, however, they actually paid less interest overall than those buying in the run-up to the GFC, not least because they got generous tax relief via MIRAS.
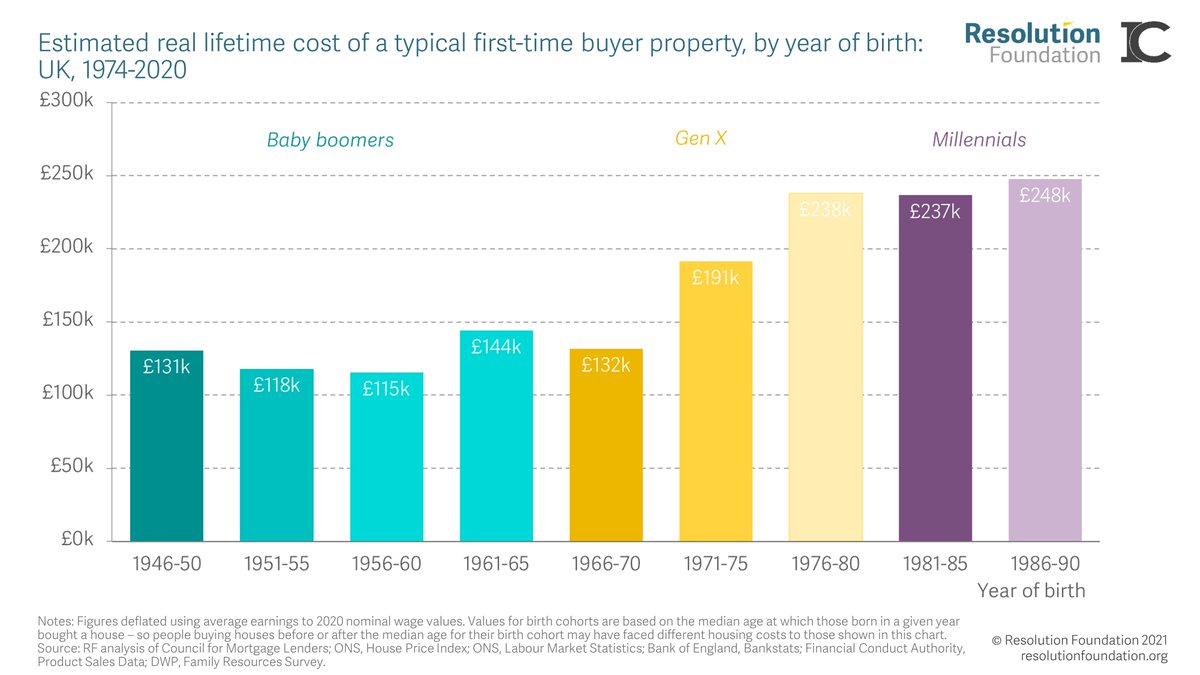
In contrast, today’s wannabe first-time buyers face much higher real house prices, requiring them to find significantly more cash both to get on the ladder in the first place and reach the point when they own their home outright.
But it’s not just millennials who have been hard hit. Total costs of buying one’s first home escalated rapidly for the Gen-Xers too.
These intergenerational differences vary considerably across the country. The typical first time in London in 2020 faced total costs of over £500,000, 2.5 times as much as the typical buyer in the capital in 1974. In the North East, costs changed just 9 per cent over that time.
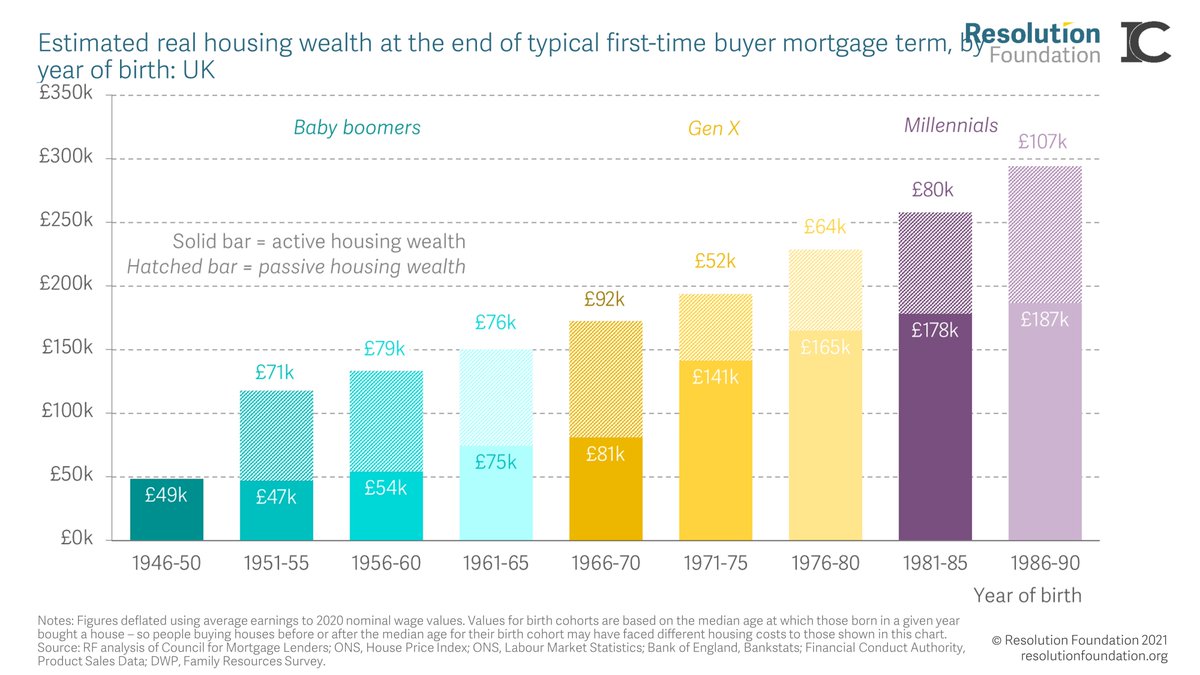
Of course, a paid-off mortgage is also money saved. But today’s first-time buyers do not look set to experience the windfall gains that older generations did when it comes to house price appreciation …
… so although they will end their first mortgage with more property wealth than any previous generation, far more of it will have been ‘active’ (i.e. saved) than ‘passive’ (i.e. the result of rampant house price growth).
Given these eye-watering figures, it’s not surprising young people today find it much harder than their parents’ and grandparents’ generation to get on the housing ladder. 55% of those born 1956-1960 were homeowners by the age of 30, compared to just 27% for those born 1981-1985
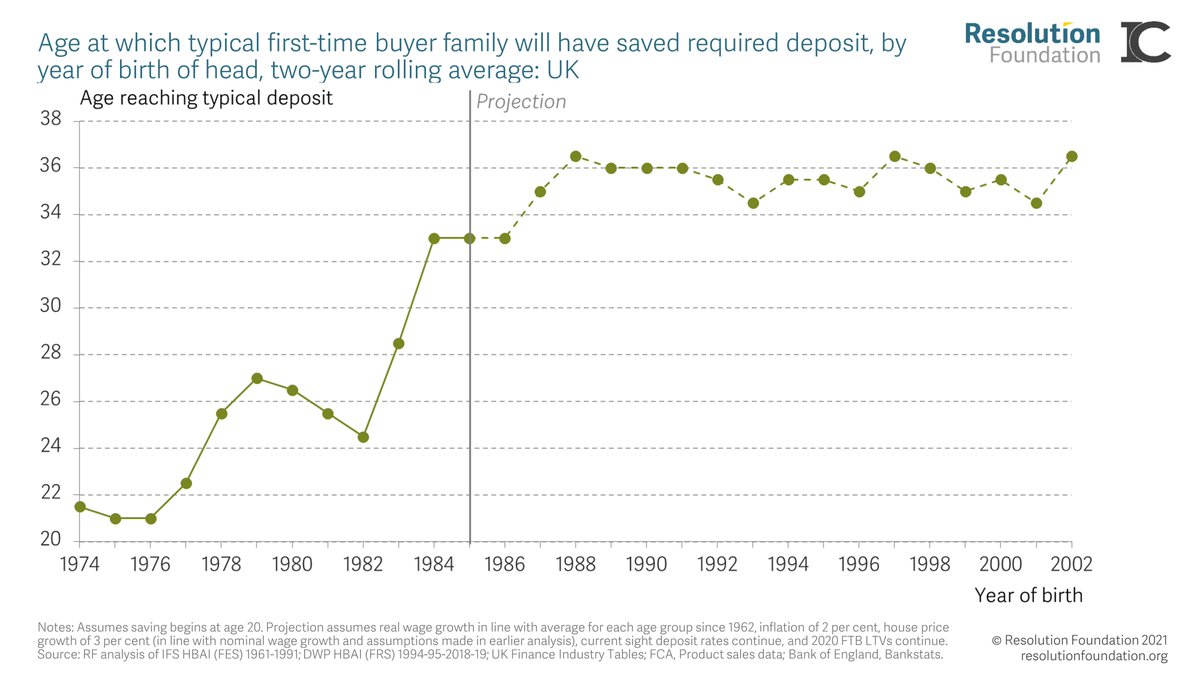
Here’s one reason why. A family headed by someone born in the early 1970s, with typical family income levels, would have saved enough for a first-time deposit by the age of 22. It will take a family headed by someone born in 2002 up to their 36th birthday to save for a deposit.
All-in-all, home ownership is increasingly the preserve of the better off. In 1996, the typical first-time buyer family had an income that put them at the 38th percentile of the income distribution of their age group; by 2020 they stand at the 48th percentile.
• • •
Missing some Tweet in this thread? You can try to
force a refresh
The Government’s new Health and Disability Green Paper will deliver tiny income gains for up to four million households, at a cost of major income losses for those who are too ill to work or no longer qualify for disability benefit support. 🧵⤵️
The gains? A boost Universal Credit (UC) support for up to four million families without any health conditions or disability by around £3 a week.
But these are overshadowed by reforms that risk causing major income losses for those too ill to work, or no longer qualify for disability benefits.
The Government plans to save £5 billion through restricting PIP by making it harder to qualify for the ‘daily living’ component.
PIP is a benefit paid regardless of whether someone is in work, to compensate for the additional costs of being disabled.
There are rumours that the Government is looking to cut the benefits bill as it tries to reduce public spending.
But has there been a huge rise in welfare spending in recent years? A quick thread👇
Social security spending rose by around 1% of GDP from the eve of the financial crash to last year, driven by rising spending on the State Pension and non-pensioner health-related benefits.
A rise yes, but hardly ‘huge’. So, is the problem rising welfare spending in the future?
The @DWP forecast is in fact for welfare spending to stay flat as a proportion of GDP from now until 2029-30, with forecast rises in spending on health-related benefits offset by the rollout of around £3bn of planned cuts to other non-pensioner benefits.
Earlier today the justice secretary pointed to a “huge rise in the welfare budget” as justification for benefit cuts to reduce public spending. So, how big has the rise in welfare spending been? 🧵
Social security spending rose by around 1% of GDP from the eve of the financial crash to last year, driven by rising spending on the State Pension and non-pensioner health-related benefits.
A rise yes, but hardly ‘huge’. So, is the problem rising welfare spending in the future?
The @DWP forecast is in fact for welfare spending to stay flat as a proportion of GDP from now until 2029-30, with forecast rises in spending on health-related benefits offset by the rollout of around £3bn of planned cuts to other non-pensioner benefits.
Since 1997 earnings have doubled, while house prices have increased *4.5 times*.
Our Research Director Lindsay Judge spoke to @BBCr4today this morning about the state of British housing 🏡🧵
Our current housing crisis is decades in the making.
The UK is not alone in considering itself in the midst of a crisis, but our cramped and ageing housing offers the worst value for money of any advanced economy.
Looking at 'imputed rents' of homeowners as well as actual rents, we spend more on housing than almost every other rich country.
Back for more? - the Resolution Foundation overnight analysis of the 2024 Spring Budget is out now!
To whet your appetite ahead of reading the full report, here's a six-chart thread with a few of the key highlights....
⬇️⬇️⬇️resolutionfoundation.org/publications/b…
1) Filling out the tax sandwich.
A net tax cut of £9 billion is taking effect in the election year. But this is dwarfed by the estimated £27 billion of tax rises that came into effect last year (2023-24) and the £19 billion that are coming in after the election (2025-27).
2) Shifting state support from the rich to the poor.
RF analysis of all major tax and benefit policies announced in this parliament show finds that typical households are set to gain £420 a year on average, while the poorest fifth gain £840 and the richest fifth lose £1,500.
Kicking off our event @_louisemurphy says that Britain has a youth mental health crisis. One-in-three 18-24-year-olds report having a common mental disorder, rising two-in-five young women.
This is having real-world impacts.
On health, more than half a million 18-24-year-olds were prescribed anti-depressants in 2021-22.
And on the labour market, people in their early 20s are now more likely to be economically inactive due to ill-health than those in their early 40s. This is a big shift over the past 25 years...