Suomen epidemia 30.6.2021: tartuntojen kasvu nousi koko epidemian korkeimmalle tasolle huhtikuun 2020 jälkeen. Tartunnat kasvavat nyt 11.2 prosenttia päivässä, eli tällä vauhdilla niiden määrä 24-kertaistuu kuukaudessa.
1/x
1/x
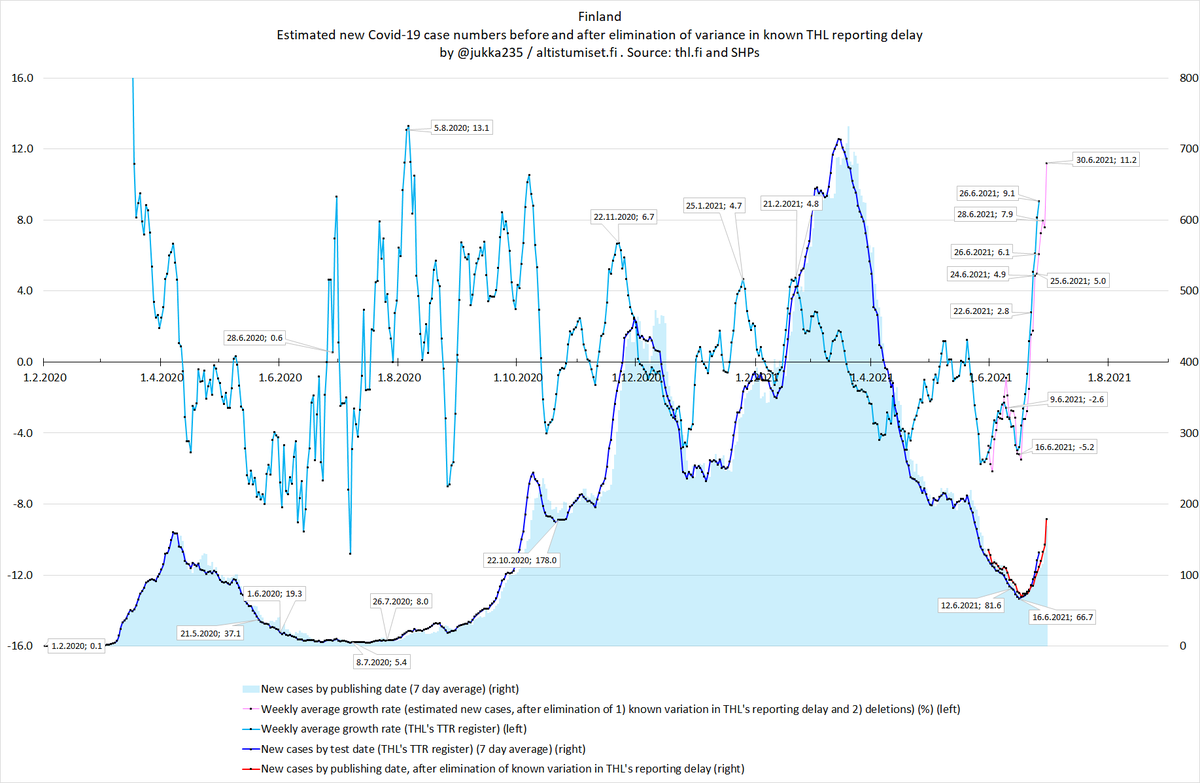
Selvyyden vuoksi: 5.8.2020 kasvu kävi korkeammalla, mutta kyseessä oli yksittäisen Skopjen koneen tartunnat, jotka saatiin hallintaan. Nyt tartuntamäärät ovat 10-kertaiset 5.8.2020 tilanteeseen verrattuna.
2/x
2/x

Tänään THL ilmoitti 355 tartuntaa, poisti 24 tartuntaa, ja tunnettu raportoinnin viive pieneni 34 tartunnan verran. Muuttumattomalla viiveellä laskettu uusien tartuntojen määrä on 355+24-31=348 (punainen viiva). Samanlaisia lukuja nähtiin viimeksi pääsiäisen jälkeen 15.4.
3/x
3/x
Tällä hetkellä 51 prosenttia tartuntojen kasvusta tulee 20-30 -vuotiaista. Osuus on kasvanut viimeisen viikon aikana.
Kiitos @EKalmanen
4/x
Kiitos @EKalmanen
4/x

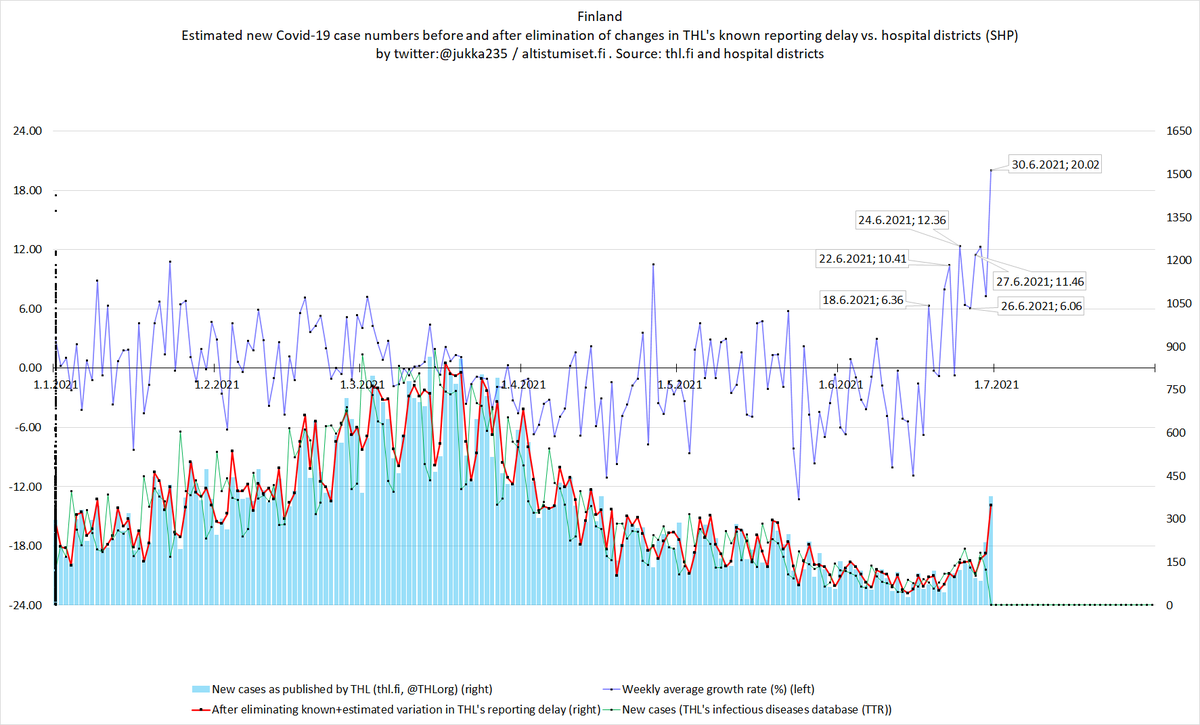
Tässä sama kuva absoluuttisina tartuntoina. 20-30 vetävät tartuntoja ylös. Tartuntojen määrän kasvu ei toistaiseksi näytä laantuneen, vaan kiihtyy edelleen.
5/x
5/x

Rokotusten määrät ovat tulleet alas noin 37 prosenttia juhannusta edeltävältä tasolta (juhannusaatto oli 25.6.). Suurin osa pudotuksesta kohdistuu 1. annokseen, mikä saattaa viitata siihen, että alempi rokotusten taso olisi alkanut jo juhannuksesta.
6/x
6/x

Rokotusten päivittäisten määrien aleneminen on kohdistunut pääasiassa 25-29 -vuotiaisiin ja sitä nuorempiin.
7/x
7/x

50-54 -vuotiaiden todennäköinen haluttomuus käydä hakemassa 1. rokotus näkyy siinä, että 45-49 -vuotiaat ovat menneet ohi. Voi tietysti olla jokin muukin syy.
8/x
8/x

Toista annosta annetaan systemaattisesti ikäjärjestyksessä. 70-74 -vuotiaat oli jo ehditty unohtaa, mutta nyt rokotettujen 70-74 -vuotiaiden määrä nousee nopeasti.
9/x
9/x

Tänään poistettiin runsaasti tartuntoja (24 kpl). Kun ilmoitettuun lukuun (355) lisätään nämä 24, uusien tartuntojen määrä on 355+24=379. Ei tietoa siitä, miksi nämä poistettiin. Ei ollutkaan positiivinen testitulos?
10/x
10/x

Skotlannissa on tullut samalla tavalla melkoinen kasa tartuntoja siitä, että ollaan käyty katsomassa jalkapalloa. 90% miehiä. 15 prosenttia niistä, jotka olivat Wembleyllä, saivat tartunnan.
11/x
web.archive.org/web/2021063012…
bbc.com/news/uk-scotla…
11/x
web.archive.org/web/2021063012…
bbc.com/news/uk-scotla…
Tulos: Skotlannin 4. aallon ilmaantuvuus nousi korkeammalla kuin 2. ja 3. aallossa missään vaiheessa. Tämä siitä huolimatta, että ...
12/x
publichealthscotland.scot/media/8268/21-…
12/x
publichealthscotland.scot/media/8268/21-…

... yli puolet yli 18-vuotiaista on rokotettu kahteen kertaan. Suomessa 2. rokotuksen tilanne on selvästi huonompi.
13/x
public.tableau.com/app/profile/ph…
13/x
public.tableau.com/app/profile/ph…

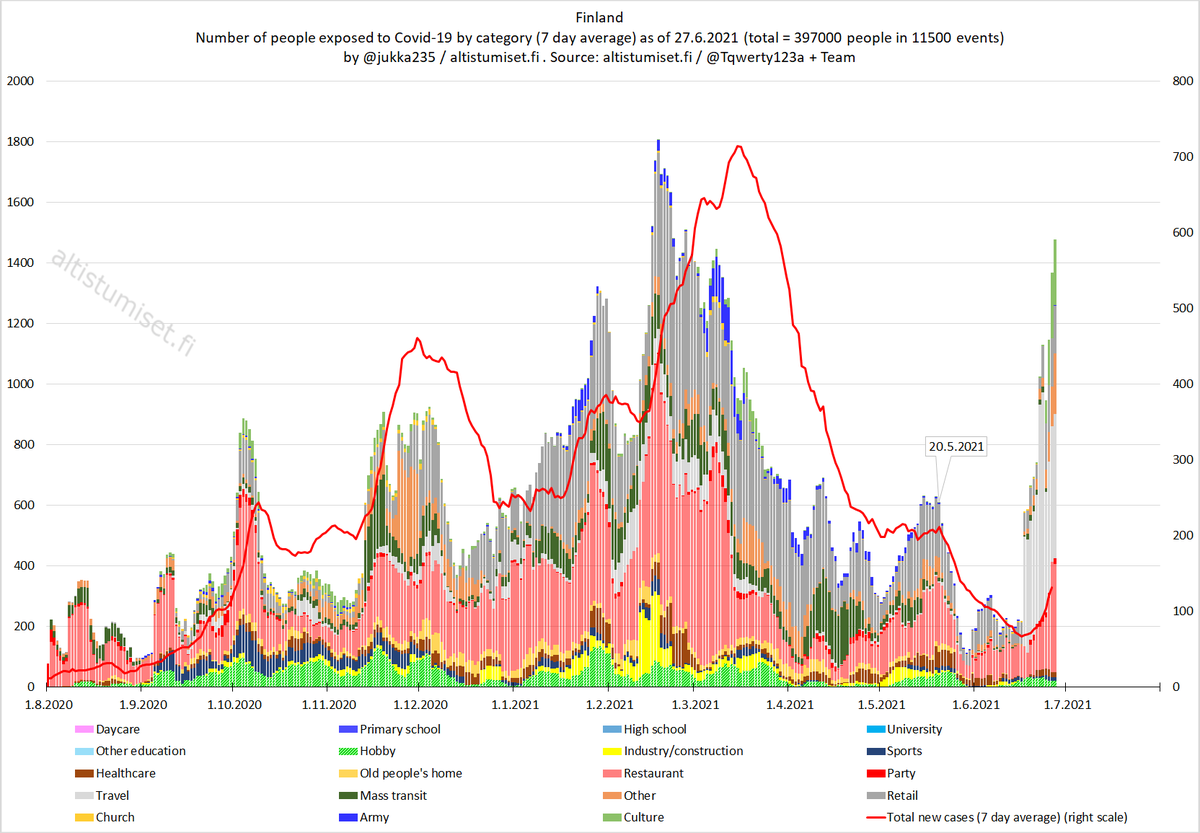
Altistumistapahtumien määrä nousee rivakkaa tahtia. Tänään ollaan kirjattu uusia altistumistapahtumia yhtä paljon kuin maaliskuun huipulla. Tarkat tiedot paikoista missä ollaan altistuttu: altistumiset.fi . @Tqwerty123a + Tiimi kerää tietoja.
14/x
#altistumiset
14/x
#altistumiset

Altistuneiden henkilöiden määrä nousee vielä nopeammin. (Nyt ollaan saatu empiirinen tulos sille, kuinka paljon voidaan löysätä määräyksiä sen jälkeen kun koulut menivät kiinni 6. kesäkuuta.)
15/x
15/x

Luvut nousivat. Tänään tehtiin koko epidemian ennätys uusien altistumisten kirjaamisessa. Altistuneiden henkilöiden määrä on noussut kerralla samalle tasolle kuin pääsiäisenä. Tarkat tiedot altistumispaikoista: altistumiset.fi .
16/x
#altistumiset
16/x
#altistumiset

Jos katsotaan niitä altistuksia, jotka vaikuttavat yli 20-vuotiaiden tartuntoihin (eli jätetään koulut ja päiväkodit pois), saadaan tulos: altistumisten määrä nousi kerralla samalle tasolle kuin maaliskuussa. @Tqwerty123a +tiimi kerää tietoja.
17/x
#altistumiset
17/x
#altistumiset
Vielä ei tiedetä, kuinka paljon tartuntoja näistä altistuksista seuraa. Viimeisen kahden viikon aikana on joka tapauksessa kertynyt poikkeuksellisen suuri määrä altistumisia.
18/x
#altistumiset
18/x
#altistumiset

• • •
Missing some Tweet in this thread? You can try to
force a refresh