
1/
This is a numerical & narrative thread looking at the relationship between NPI (mandate) stringency and state level COVID outcomes in the USA.
Contents:
1) discuss motivation
2) present methods and sources
3) present results and implications
This is a numerical & narrative thread looking at the relationship between NPI (mandate) stringency and state level COVID outcomes in the USA.
Contents:
1) discuss motivation
2) present methods and sources
3) present results and implications
2
Motivation:
NPIs are disruptive. Nowhere in life do we entertain harm unless there is potential benefit. We are 16 months into this and have completed a full "epidemic cycle". We are in a period of COVID-19 quiescence nationally.
It's a good time to examine the results.
Motivation:
NPIs are disruptive. Nowhere in life do we entertain harm unless there is potential benefit. We are 16 months into this and have completed a full "epidemic cycle". We are in a period of COVID-19 quiescence nationally.
It's a good time to examine the results.

3/
So why examine the USA in isolation?
1) We have a heterogenous response (Oxford Stringency Avg 41.6 SDEV 9.2)
2) We have diverse demographics in key variables
3) '57, '68, 2009 Influenza pandemic outcomes suggest wide inter-country variation and 2+ years to "mature"
So why examine the USA in isolation?
1) We have a heterogenous response (Oxford Stringency Avg 41.6 SDEV 9.2)
2) We have diverse demographics in key variables
3) '57, '68, 2009 Influenza pandemic outcomes suggest wide inter-country variation and 2+ years to "mature"

4/
Let’s discuss the following papers in a bit of detail:
ncbi.nlm.nih.gov/pmc/articles/P…
pubmed.ncbi.nlm.nih.gov/17189032/
pubmed.ncbi.nlm.nih.gov/24302890/
pubmed.ncbi.nlm.nih.gov/15962218/
Let’s discuss the following papers in a bit of detail:
ncbi.nlm.nih.gov/pmc/articles/P…
pubmed.ncbi.nlm.nih.gov/17189032/
pubmed.ncbi.nlm.nih.gov/24302890/
pubmed.ncbi.nlm.nih.gov/15962218/
5/
Highlights:
There was a 25-70 fold geographic variation in mortality with the '68 Influenza A H2N2 epidemic.
In line with 1918 and 2009 Influenza pandemic analyses.
Highlights:
There was a 25-70 fold geographic variation in mortality with the '68 Influenza A H2N2 epidemic.
In line with 1918 and 2009 Influenza pandemic analyses.


6/
In '57, there was substantial residual variation even within a region after adjusting for development indicators. Interestingly, the singled out Scandinavia as a notable example where Finland experienced substantially higher mortality than Denmark or Sweden. 🤨
In '57, there was substantial residual variation even within a region after adjusting for development indicators. Interestingly, the singled out Scandinavia as a notable example where Finland experienced substantially higher mortality than Denmark or Sweden. 🤨

7/
The inter-country variation may be attributable to prior exposure to H1N1 thereby reducing the severity of the H2N2 infection (UK, Canada, NE USA in 1951). In some regions, preceding severe Influenza episodes may have led to the death of more frail before the advent of H2N2.
The inter-country variation may be attributable to prior exposure to H1N1 thereby reducing the severity of the H2N2 infection (UK, Canada, NE USA in 1951). In some regions, preceding severe Influenza episodes may have led to the death of more frail before the advent of H2N2.

8/
And the mortality impact might manifest over the course of the entire pandemic. This was seen in the ’57 and ’68 Influenza pandemics.
And the mortality impact might manifest over the course of the entire pandemic. This was seen in the ’57 and ’68 Influenza pandemics.


9/
We see a light mortality year in Sweden in 2019. In 2019, Swedish excess mortality was 1-4 standard deviations below normal which was not demonstrated in the rest of Scandinavia (UK excess for comparison). But Scandinavia C19 Twitter is very 2020. #TimeToMoveOn
We see a light mortality year in Sweden in 2019. In 2019, Swedish excess mortality was 1-4 standard deviations below normal which was not demonstrated in the rest of Scandinavia (UK excess for comparison). But Scandinavia C19 Twitter is very 2020. #TimeToMoveOn


10/
All of this emphasizes the benefits of looking at one nation when assessing NPIs. So let’s dive in.
Factors examined:
-Oxford NPI Stringency Index
-C19 and Excess Deaths/M
-% Obesity
-% population >65yo
-Crowding Index
-% Multigen Households
-Annual Precipitation
All of this emphasizes the benefits of looking at one nation when assessing NPIs. So let’s dive in.
Factors examined:
-Oxford NPI Stringency Index
-C19 and Excess Deaths/M
-% Obesity
-% population >65yo
-Crowding Index
-% Multigen Households
-Annual Precipitation
11/
Obesity and Age are the 2 most prevalent modifiers of disease severity and plausibly influence transmission:
acpjournals.org/doi/full/10.73…
pnas.org/content/118/8/…
The age gradient influences the potential importance of multigen households evident in the regression analysis below.
Obesity and Age are the 2 most prevalent modifiers of disease severity and plausibly influence transmission:
acpjournals.org/doi/full/10.73…
pnas.org/content/118/8/…
The age gradient influences the potential importance of multigen households evident in the regression analysis below.


12/
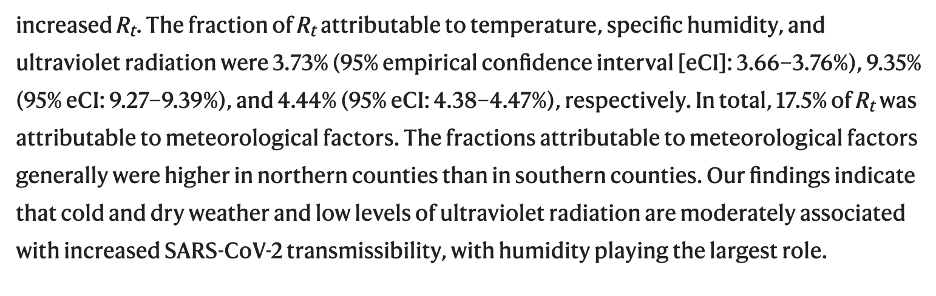
Annual precipitation was used as a proxy for humidity given the following paper on seasonal impacts.
nature.com/articles/s4146…
While I have concerns with any analysis excluding Q1 2021 data, humidity was deemed the largest meteorological factor.
Annual precipitation was used as a proxy for humidity given the following paper on seasonal impacts.
nature.com/articles/s4146…
While I have concerns with any analysis excluding Q1 2021 data, humidity was deemed the largest meteorological factor.
13/
Data Sources:
bsg.ox.ac.uk/research/resea…
data.census.gov/cedsci/table?q…
statista.com/statistics/378…
americashealthrankings.org/explore/annual…
cdc.gov/nchs/nvss/vsrr…
Data Sources:
bsg.ox.ac.uk/research/resea…
data.census.gov/cedsci/table?q…
statista.com/statistics/378…
americashealthrankings.org/explore/annual…
cdc.gov/nchs/nvss/vsrr…
14/
(technical -- ignore if desired)
Methods:
1) Deaths were normalized to count per million of population
2) Linear and Quadratic regression was used. Higher order regression was not used to avoid over-fitting.
3) Log transformation considered, but NOT used
(technical -- ignore if desired)
Methods:
1) Deaths were normalized to count per million of population
2) Linear and Quadratic regression was used. Higher order regression was not used to avoid over-fitting.
3) Log transformation considered, but NOT used
15/
*Raw* Deaths/M showed weak reduction with higher stringency and correlation was weaker than with obesity rates: 2.8% vs. 7.1%
*Raw* Deaths/M showed weak reduction with higher stringency and correlation was weaker than with obesity rates: 2.8% vs. 7.1%


16/
% population >65yo did not correlate with a *Raw* Deaths/M difference (<<1%).
This is due to the fact that the % >65yo is ~ similar nationally (16.5% STDEV 1.9%). Therefore, predictably, adjusting for age distribution to varying degrees was not a notable differentiator.
% population >65yo did not correlate with a *Raw* Deaths/M difference (<<1%).
This is due to the fact that the % >65yo is ~ similar nationally (16.5% STDEV 1.9%). Therefore, predictably, adjusting for age distribution to varying degrees was not a notable differentiator.


17/
The impact of BMI on relative risk of severe C19 is higher when younger and therefore more relevant for 80-85% of the population of a state. Consequently, when we adjust for Deaths/M for obesity rates, the already weak effect of NPI stringency disappears.
The impact of BMI on relative risk of severe C19 is higher when younger and therefore more relevant for 80-85% of the population of a state. Consequently, when we adjust for Deaths/M for obesity rates, the already weak effect of NPI stringency disappears.


18/
Annual precipitation and multigenerational households also demonstrated weak effects.
Annual precipitation and multigenerational households also demonstrated weak effects.


19/
You’ll notice how the regression is heavily biased by Hawaii. 5.5h flight from CA, it would be disingenuous to suggest Hawaii is not in a unique situation. If we remove Hawaii from the multigenerational HH regression, a correlation even stronger than obesity emerges.
You’ll notice how the regression is heavily biased by Hawaii. 5.5h flight from CA, it would be disingenuous to suggest Hawaii is not in a unique situation. If we remove Hawaii from the multigenerational HH regression, a correlation even stronger than obesity emerges.


20/
Even in the “Mask Havens” of East Asia, people do not mask at home. That said, there is evidence from studies of NPIs in Influenza that NPIs might increase the % of infections from aerosols (>50%) and aerosol mediated infections may be more severe: ncbi.nlm.nih.gov/pmc/articles/P…
Even in the “Mask Havens” of East Asia, people do not mask at home. That said, there is evidence from studies of NPIs in Influenza that NPIs might increase the % of infections from aerosols (>50%) and aerosol mediated infections may be more severe: ncbi.nlm.nih.gov/pmc/articles/P…
21/
I discuss the paper and implications in detail here:
Viral aerosols range in the 0.1um to 0.5um range and take ~48h to settle. Even properly fitted N95s are rated at 0.3-0.5um.
cdc.gov/niosh/topics/a…
I discuss the paper and implications in detail here:
https://twitter.com/contrarian4data/status/1405277040048152577?s=20
Viral aerosols range in the 0.1um to 0.5um range and take ~48h to settle. Even properly fitted N95s are rated at 0.3-0.5um.
cdc.gov/niosh/topics/a…


22/
So what benefits did we accrue with business closures, school closures, mask mandates? Nothing really.
Indeed, on top of divisiveness, acrimony, school closures, stay-at-home orders may have increased spread in multigenerational households (disproportionately ethnic).
So what benefits did we accrue with business closures, school closures, mask mandates? Nothing really.
Indeed, on top of divisiveness, acrimony, school closures, stay-at-home orders may have increased spread in multigenerational households (disproportionately ethnic).
23/
This disproportionate impact on low wage essential worker ethnic households manifested quite clearly:
When you arrive at the same conclusions looking at the data in multiple ways, you’ve arrived at a version of truth.
This disproportionate impact on low wage essential worker ethnic households manifested quite clearly:
https://twitter.com/Emily_Burns_V/status/1398035286752382977?s=20
When you arrive at the same conclusions looking at the data in multiple ways, you’ve arrived at a version of truth.
24/
Interestingly, none of this was particularly surprising. How differently would matters have gone if the respected Dr. DA Henderson of Smallpox eradication was alive?
liebertpub.com/doi/pdfplus/10…
Interestingly, none of this was particularly surprising. How differently would matters have gone if the respected Dr. DA Henderson of Smallpox eradication was alive?
liebertpub.com/doi/pdfplus/10…
https://twitter.com/snorman1776/status/1409576452295639040?s=20
25/
Everything we've done since Feb '20 has been a complete abdication of a rational risk based conversation:
No surprise the Pediatric vax conversation is in the same intellectual void despite signal evident more than 6w ago:
Everything we've done since Feb '20 has been a complete abdication of a rational risk based conversation:
https://twitter.com/galexybrane/status/1409573413874638858?s=20
No surprise the Pediatric vax conversation is in the same intellectual void despite signal evident more than 6w ago:
https://twitter.com/contrarian4data/status/1396650875045629953?s=20
Despite the above, “experts” continue to pine away about mitigations and engage in campaigns of fear about the latest variant citing “our race to herd immunity”.
Our cases didn’t plummet in mid-Jan '21 because we hit herd immunity & the UK is not imploding from “Delta”.
Our cases didn’t plummet in mid-Jan '21 because we hit herd immunity & the UK is not imploding from “Delta”.


27/
Functional definition of an “expert”: someone who is more right than wrong in the face of uncertainty.
By any measure, “experts” repeating refrains from last year should be disqualified.
Functional definition of an “expert”: someone who is more right than wrong in the face of uncertainty.
By any measure, “experts” repeating refrains from last year should be disqualified.
28/
Hopefully you can see that there is data to be analyzed robustly and application of rigor would suggest that they should change their tune.
They have not.
Hopefully you can see that there is data to be analyzed robustly and application of rigor would suggest that they should change their tune.
They have not.
29/
Indeed, some act as if they have discovered a powerful tool in NPIs and they are propped up by what can only be described as officially sanctioned misinformation.
How much more will it take for you to reject what they have to offer?
Indeed, some act as if they have discovered a powerful tool in NPIs and they are propped up by what can only be described as officially sanctioned misinformation.
How much more will it take for you to reject what they have to offer?
We should have never allowed this to happen. All we can do now is make sure that it never happens again
/end
/end
• • •
Missing some Tweet in this thread? You can try to
force a refresh


