Ben Casselman Profile picture
Jul 2, 2021 14 tweets 6 min read Read on X
Time for a #jobsday charts thread! Starting off a bit differently this month: Wages.
Avg. earnings up 10 cents/hour in June, and 43 cents over the past three months.
On one hand: Growth slowing. OTOH: Earnings now well above pre-pandemic trajectory.
We're seeing serious wage pressure in leisure and hospitality, consistent with anecdotal reports. Avg. earnings for nonsupervisors up 37 cents/hour in June, and more than $1.50 over past year.
Despite drop early in pandemic, their wages are now also above pre-crisis trend.
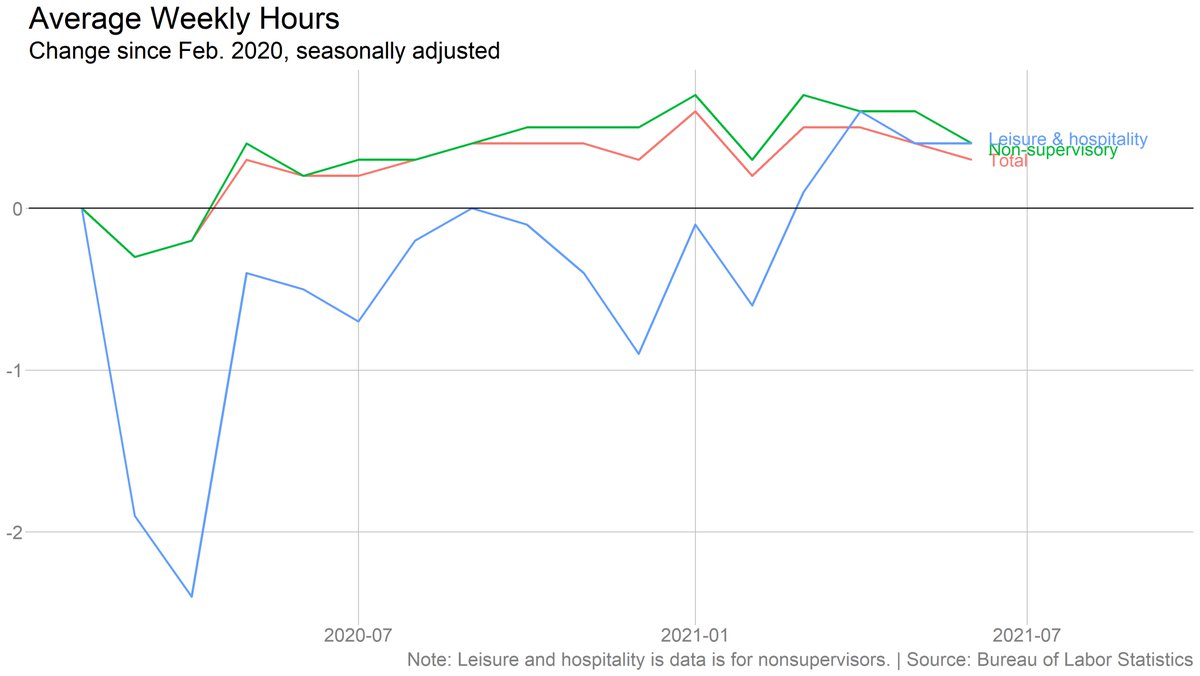
Notably, though, average weekly hours fell, both overall and for leisure and hospitality. That's surprising in an environment where employers can't find enough workers.
On the other hand, big drop in involuntary part-time work. That suggests people who want to work full-time are having an easier time finding hours.
People are returning to the office! (I can vouch: Much of our jobs day team is in-person today.) Less than 15% of all workers were remote due to the pandemic in June, down from 35% last May.
The unemployment rate ticked up in June, to 5.9%. But if you factor in people who have left the labor force in the pandemic, it actually ticked down slightly to 8.6%. (This approach roughly replicates what the Fed has been discussing.)
Speaking of the labor force! It grew slightly last month, though participation was flat. Participation rate is still WELL below its prepandemic level.
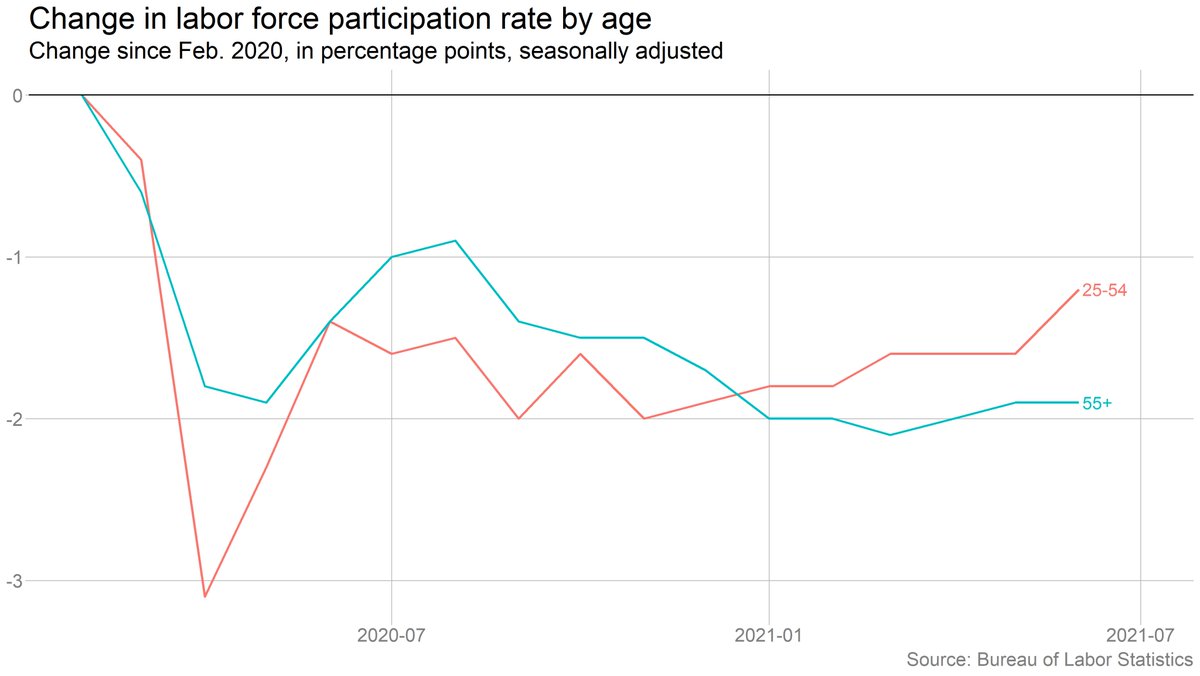
Participation did rise for prime-age (25-54) workers, especially women. Could be a sign people are returning to work as child care options return, although we'll need more detailed data to draw any real conclusions.
This is interesting: In the spring, teen employment was running way above its recent normal. Much less true in June -- teen employment rate (not seasonally adjusted) was pretty close to its pre-pandemic level. Suggests teens aren't doing much to boost labor supply this summer.
Participation is rebounding for prime-age adults, but not for those 55 and up.
Black workers saw some employment gains last month, but they (along with Hispanics) are still lagging in the recovery. And Black unemployment ticked up to 9.2% (vs. 5.2% for white workers).
The unemployment rate rose last month, but mostly because more people quit their jobs or reentered the labor force to look -- both signs of confidence among workers.
(Did I make this chart just because I wanted to use the headline? Perhaps.)
One more note re: wages: The recent spike in earnings has been significantly more pronounced in full-service restaurants than limited service. That's consistent with @joshbivens_DC's argument that much of this is about tips.
BUT limited-service still way above prepandemic trend.
Note: The divergence between the household and payroll surveys appears to be due in part to differences in the concepts being measured (people vs jobs, W-2 vs 1099, etc). But probably also just reflects normal variation -- over 6 mos., the two surveys are closely aligned.

• • •

Missing some Tweet in this thread? You can try to force a refresh
 

Keep Current with Ben Casselman

Ben Casselman Profile picture

Stay in touch and get notified when new unrolls are available from this author!

Read all threads

This Thread may be Removed Anytime!

PDF

Twitter may remove this content at anytime! Save it as PDF for later use!

Try unrolling a thread yourself!

how to unroll video
  1. Follow @ThreadReaderApp to mention us!

  2. From a Twitter thread mention us with a keyword "unroll"
@threadreaderapp unroll

Practice here first or read more on our help page!

More from @bencasselman

Nov 4
So this was an interesting finding from @NateSilver538, but one I found odd because @BLS_gov publishes CPI for regions (and for some metro areas) but not for states. So I dug into it a bit, and there's less here than meets the eye.
Nate's data is coming from this tracker from the @JECRepublicans. They don't have a state-level inflation estimate either, though. They just use BLS's estimate of regional inflation and apply it to an estimate of household spending when Biden took office.
jec.senate.gov/public/index.c…
You can see this if you hover over their map (or download their data). States in the same region all have the same cumulative rates of inflation. But they differ in the amount of inflation experienced in dollar terms because some states have higher avg household incomes.
Read 14 tweets
Aug 28
I hate that @ellawinthrop is leaving us, but I'm so glad I got to work with her on her last piece for @nytimesbusiness. She's the best, most collaborative, most creative visual journalist I've ever worked with. A thread with a few of my favorite Ben-and-Ella collabs:
1. This iconic chart showing the scale of the pandemic job losses:
nytimes.com/interactive/20…
2. This piece digging deep into the American Time Use Survey to look at how the pandemic changed our lives:
nytimes.com/interactive/20…
Read 6 tweets
Jul 11
Good news on inflation! U.S. consumer prices FELL 0.1 percent in June, and were up just 3 percent from a year earlier. "Core" prices, stripping out volatile food and fuel, were up 0.1 percent from May and 3.3 percent from last June. Data: …Live coverage: bls.gov/news.release/c…
nytimes.com/live/2024/07/1…
This is the second straight month where there has been effectively no inflation on a month-to-month basis. Prices were flat in May, and down in June.
If you take a longer view here: At 3% year-over-year, inflation is no longer outside historical norms (though it is still higher than immediately prepandemic). And over the past three months, rents have risen at an annual rate of ***just 1.1%.***
Image
Image
Read 7 tweets
Jul 2
Job openings ticked up in May (but only because April was revised down). Layoffs edged up. Quits basically flat. All consistent with a gradually slowing, but not collapsing, job market. #JOLTS
Full data: bls.gov/news.release/j…
There were 8.1 million job openings on the last day of May. That's up from 7.9 million in April, revised down from the 8.1m originally reported.
Larger story here is that openings are clearly falling quickly, even if they're still high in absolute terms. #JOLTS Image
There were 1.2 job openings for every unemployed worker in May. That's more or less where things stood immediately before the pandemic (when the labor market was widely viewed as strong but not overheated). Image
Read 7 tweets
Jan 25
The U.S. economy slowed in the final three months of the year, but only because the Q3 number was so strong -- the 3.3% growth rate in Q4 was well above expectations and certainly offered no hints of a brewing recession. (Belated charts thread)
Image
This is not a case where the volatile components of G.D.P. made a weak quarter look strong, as sometimes happens. Measures of underlying demand were also very strong.
Image
Image
For all the predictions of a recession, G.D.P. growth actually *accelerated* in 2023, and topped the prepandemic average growth rate as well. Image
Read 4 tweets
Jan 3
Job openings, quits and layoffs all edged down slightly in November. Consistent with a gradually cooling labor market, but definitely no sign things are falling off a cliff. #JOLTS
Data: bls.gov/news.release/j…
There were 8.8 million job openings on the last day of November. That's down a touch from October, but only because October was revised up. Big picture: Openings are trending down (and quite quickly, at that), but are still high by historical standards. #JOLTS Image
The number of job openings per unemployed worker actually ticked up in November (because unemployment fell), but ignore the noise. The labor market is becoming more balanced, though the ratio is (again) high relative to the prepandemic period. Image
Read 9 tweets

Did Thread Reader help you today?

Support us! We are indie developers!


This site is made by just two indie developers on a laptop doing marketing, support and development! Read more about the story.

Become a Premium Member ($3/month or $30/year) and get exclusive features!

Become Premium

Don't want to be a Premium member but still want to support us?

Make a small donation by buying us coffee ($5) or help with server cost ($10)

Donate via Paypal

Or Donate anonymously using crypto!

Ethereum

0xfe58350B80634f60Fa6Dc149a72b4DFbc17D341E copy

Bitcoin

3ATGMxNzCUFzxpMCHL5sWSt4DVtS8UqXpi copy

Thank you for your support!

Follow Us!

:(