
A Master thread on @Singh7575 Sir's Long Only Setups with examples on Charts!
This setup is a gift to anyone who trades long ideas and those who want to trade in CASH due to Capital Constraint. Fits best for people who don't do FNO as this picks some amazing scripts.
This setup is a gift to anyone who trades long ideas and those who want to trade in CASH due to Capital Constraint. Fits best for people who don't do FNO as this picks some amazing scripts.
1⃣ Before heading on to the set-up we want to make sure the entire system credit goes to @Singh7575 . We are just here to share it and make people aware of such simple set-ups that can give money considering risk is managed.
t.me/AngadSingh_Ema…
t.me/AngadSingh_Ema…
2⃣How to Set it Up?
This setup best fits in @tradingview /@zerodhaonline or any broker that provides charting. We only need 2 Indicators.
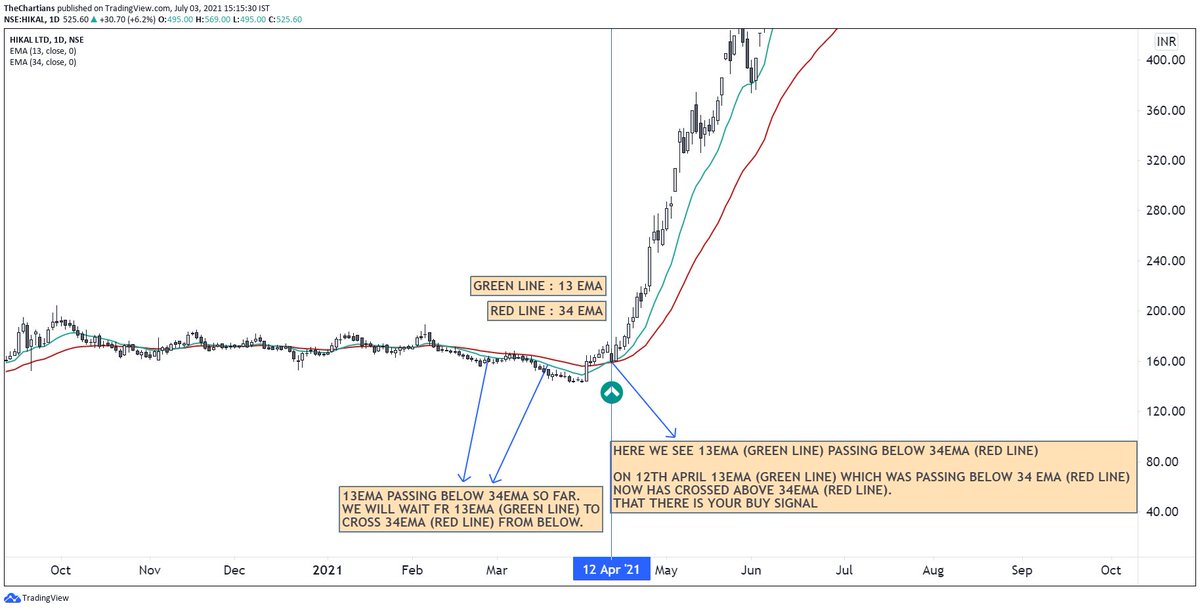
Indicator 1- 13EMA
Indicator 2 - 34EMA
Both indicators are compulsory and should be exponential(EMA) instead of Simple moving average.(SMA)
This setup best fits in @tradingview /@zerodhaonline or any broker that provides charting. We only need 2 Indicators.
Indicator 1- 13EMA
Indicator 2 - 34EMA
Both indicators are compulsory and should be exponential(EMA) instead of Simple moving average.(SMA)
3⃣ How to use this Setup?
Whenever this Setup meets a condition where 13EMA crosses 34EMA from below as depicted in the chart. Whenever the 13EMA crosses 34EMA from below it is a LONG (BUY) SIGNAL.
❗️Timeframe needs to be Daily Only!
Whenever this Setup meets a condition where 13EMA crosses 34EMA from below as depicted in the chart. Whenever the 13EMA crosses 34EMA from below it is a LONG (BUY) SIGNAL.
❗️Timeframe needs to be Daily Only!
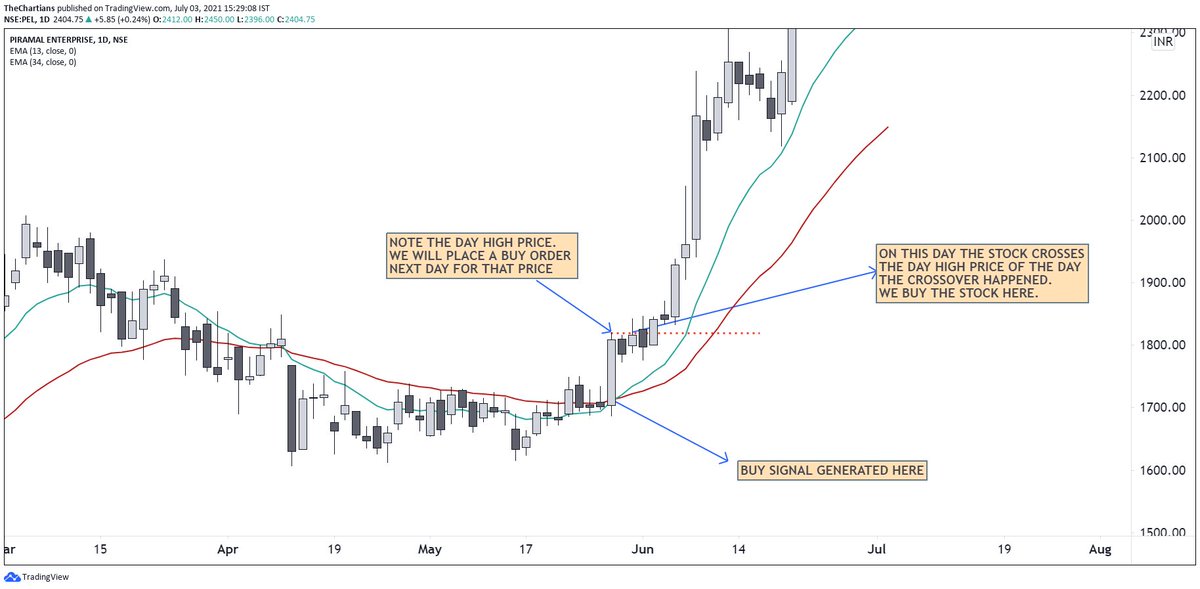
4⃣ When to Place Order?
The Condition is to place order above the Day's High when crossover happened. Place buying bid above Previous Day’s high. If on current day the stock
doesn’t cross previous day’s high, place a buying bid the next day above current day’s high. For E.g.
The Condition is to place order above the Day's High when crossover happened. Place buying bid above Previous Day’s high. If on current day the stock
doesn’t cross previous day’s high, place a buying bid the next day above current day’s high. For E.g.
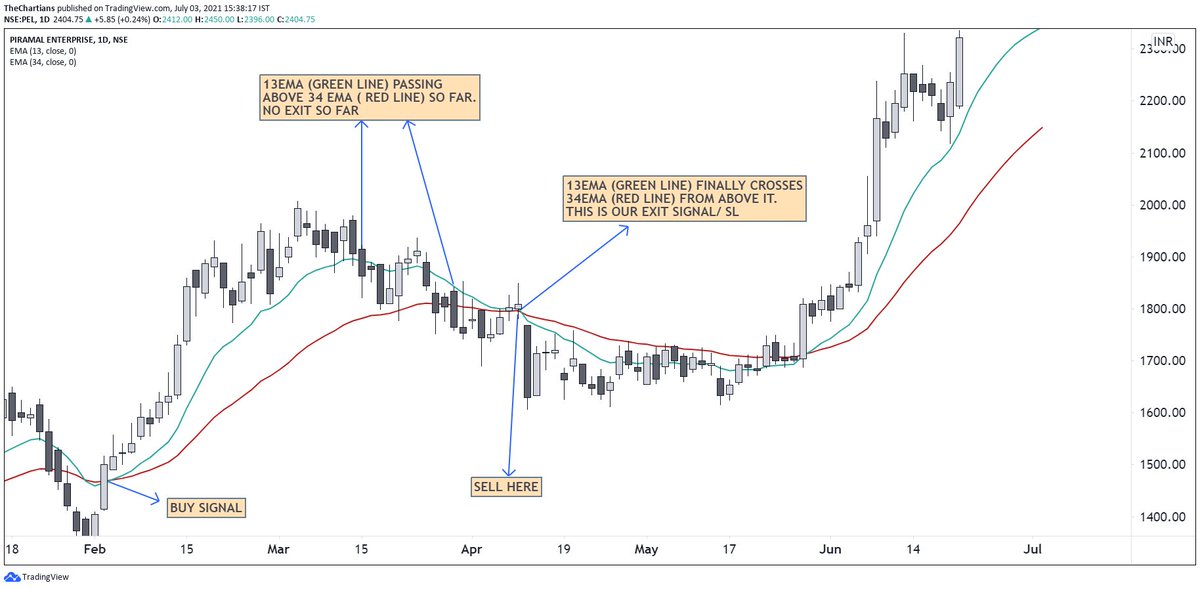
5⃣SETUP REQUIREMENTS FOR EXIT (SL)
Whenever the 13EMA crosses 34EMA from above it is a signal to EXIT or take your SL. For E.g.
Whenever the 13EMA crosses 34EMA from above it is a signal to EXIT or take your SL. For E.g.
6⃣ HOW WE MODIFIED SL?
SL is a very subjective but vital part in any trading setup. Some take SL based on certain%, PREVIOUS DAY LOW, WEEK LOW. For our comfort on the system we usually take SL as following.
SL is a very subjective but vital part in any trading setup. Some take SL based on certain%, PREVIOUS DAY LOW, WEEK LOW. For our comfort on the system we usually take SL as following.
The stock has already moved up +5% we take that DAY LOW, stock has not moved +5% we take PREVIOUS DAY LOW.
Entry is near a SWING LOW we take SWING LOW as SL.
Entry is near a SWING LOW we take SWING LOW as SL.
7⃣ This stays as the condition that SL can be as per your comfort. Every system has a SL of a different nature. We keep that on our capital and risk appetite.
8⃣Below are some examples based on this system. Entries are subjective as we have tweaked this setup according us. ( Coz we are hard-core Price Action lovers)
Let's see how we did it.
Let's see how we did it.
9⃣Whenever the stock gave a crossover for long setup we always took stocks that would be a potential breakout sooner approaching its swing high tested multiple times. Let's see 8 examples which we traded.


🔟 Do Re-tweet for wider reach. We appreciate the efforts by @Singh7575 sir for sharing this setup for Free. All the credit goes to him. We have just tried to reach out to audience who are busy in office work or can't track everything manually. This setup needs less screentime.
But can surely make MONEY considering risk is managed. Thank you and please retweet for wider reach.
Angad Sir's YouTube Channel.
youtube.com/user/singh7575
Angad Sir's YouTube Channel.
youtube.com/user/singh7575
• • •
Missing some Tweet in this thread? You can try to
force a refresh


