James Ward Profile picture
Jul 4, 2021 7 tweets 3 min read Read on X
A quick Sunday case data round-up. First, the age-group growth rate charts continue to show a declining trend in short-term growth. I’ll start with the 0-30s today:
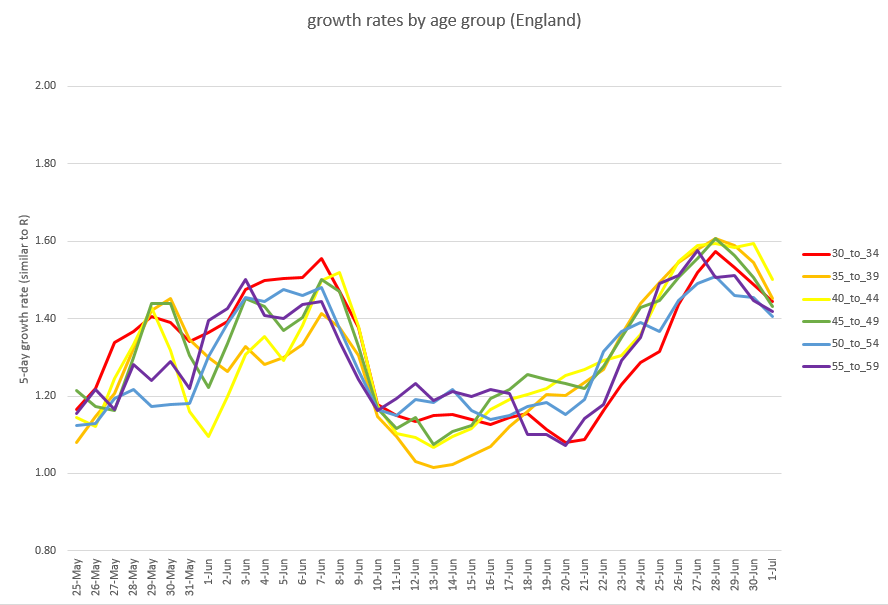
and then the 30-60s, also with a clear declining trend:
and lastly the 60-90s, now mostly holding at a fairly steady growth rate (which is better than where they were a few days ago, with accelerating growth). (ctd)
I think the question is no longer: is growth falling? But rather: what will it do next? Does it keep going down (great news), stabilise at a new level (less good, but still better than it was), or bounce back up (bad news)? Mesdames et messieurs, faites vos jeux….
Taking a quick look at the regional data, it’s clear that (as others have noted, and I flagged as a concern over 2 weeks ago), the North East is now the region with the highest case rates – and still concentrated in the 10-30 year olds:
And looking at growth rates rather than case rates, the North East remains in the lead (which is not a good place to be). I’m not particularly liking the trend in the South East either.
Finally, just keeping an eye on the male:female split, in case the football makes a difference. Case rates continue to be more male-biased than normal, and particularly in the 15-40s (and, more surprisingly, the 75-90s). But there’s been no big shifts in recent days. /end

• • •

Missing some Tweet in this thread? You can try to force a refresh
 

Keep Current with James Ward

James Ward Profile picture

Stay in touch and get notified when new unrolls are available from this author!

Read all threads

This Thread may be Removed Anytime!

PDF

Twitter may remove this content at anytime! Save it as PDF for later use!

Try unrolling a thread yourself!

how to unroll video
  1. Follow @ThreadReaderApp to mention us!

  2. From a Twitter thread mention us with a keyword "unroll"
@threadreaderapp unroll

Practice here first or read more on our help page!

More from @JamesWard73

Dec 29, 2022
When I wrote my thread before Christmas (linked below) I promised you a postscript on the interaction between vaccines and NPIs, so here it is. And it’s good news – the combined effect is more powerful than I expected. 🧵 1/25
Let’s start with what I expected. In an endemic model, with no vaccines, there is essentially a “required” rate of infection which is needed to keep immunity levels topped up at their equilibrium (herd immunity threshold) level. 2/25
NPIs can reduce this equilibrium level, and hence also the required rate of infection – although as we’ve seen in other threads, the % reduction in the infection rate is usually less than the % impact of the NPIs on transmission. 3/25
Read 26 tweets
Dec 19, 2022
So Covid Twitter (and Twitter in general) seems to be dying… with just a few limbs still twitching. To be fair I haven’t been helping much this year, having held true to my New Year’s Resolution to spend time talking to my family rather than on Excel and Twitter. 🧵
So many thanks to those (including but not limited to @BristOliver @PaulMainwood @kallmemeg @john_actuary @chrischirp) who have kept things going this far. But I haven’t completely given up the modelling thing, and there’s a couple of new things I’d like to show you.
So for old times’ sake, and as an early Christmas present, here goes with probably my last ever Twitter thread (and yes, I know it would probably work better on Substack, and maybe I should replicate it on Mastodon &/or Post, but just for today, let’s remember Twitter as it was).
Read 46 tweets
Oct 11, 2022
@TAH_Sci @i_petersen @karamballes @chrischirp @CathNoakes @MichaelSFuhrer @MichaelPlankNZ I agree our biggest concern right now should be booster take-up in 65+, but I’d be a bit more open to the case for “clean air” interventions. It’s possible that the business case for doing this in some settings actually does stack up, and imo we should be investigating this, …
@TAH_Sci @i_petersen @karamballes @chrischirp @CathNoakes @MichaelSFuhrer @MichaelPlankNZ … while being very realistic about the costs and benefits. If we’re happy to start with a basic model (and then refine it) then there’s really only three things we need to work out:
1) what % of transmission do we expect to be interrupted in the specific settings it is used?
@TAH_Sci @i_petersen @karamballes @chrischirp @CathNoakes @MichaelSFuhrer @MichaelPlankNZ 2) what % of overall transmission is accounted for by those specific settings?

Multiplying 1) and 2) gives us the overall % reduction in transmission. And then we need to convert that into a reduction in medium-term prevalence. @MichaelPlankNZ gives us the formula here:
Read 9 tweets
Jul 26, 2022
really nice analysis from @Jean__Fisch here using the SIREN data to imply changing patterns in the amount of protection that previous infection is giving in each wave. A few points to note:
- infection seems to give strong protection through the autumn 2020 and the Alpha wave
- this reduces (through the combined effects of waning, immune escape and impact of vaccinations) for the Delta wave
- and for the first Omicron (BA.1) wave, there appears to be no benefit from prior infection. I don’t believe this is literally true: more likely there was a…
…small benefit but it may be offset by demographic confounders eg those more likely to be exposed in one wave are also more likely to be exposed in the next
- the good news is that the protection recovers in the later Omicron waves, suggesting that BA.1/BA.2 infection does…
Read 5 tweets
Jun 30, 2022
I’ve been looking at this question the other way around, but it’s still very gently encouraging I think. The case curve is continuing with exponential growth (straight line on the log plot) for much longer than we would have liked. We might have expected it to curve over by now
…as the effect of growing immunity to the latest variant starts to bring the R number down. We’ve had a couple of false dawns already (what do we call these, they can’t be “dead cat bounces” because we’re still going up… so maybe “live cat slumps”?), but still it keeps rising.
I *think* what’s going on here is not that immunity has suddenly stopped working, but rather that the effect of growing immunity is being offset by something else. The obvious candidate (as explored in Oliver’s thread) is the upwards pressure from continued variant mix changes.
Read 8 tweets
Jun 14, 2022
This is important from @AdamJKucharski – and consistent with the maths I outlined in threads about endemicity late last year: (which will have been very familiar territory to Adam and other experts in this field). To draw out a couple of key implications:
1. From a mathematical perspective, the arrival of new variants is a bit like waning host immunity, and has much the same effect (i.e. immunity gets lower). It arrives in a slightly different way (at the same time for everyone, rather than gradually across the population)
...which will affect the short-term dynamics, and mean that we’re more likely to get new peaks and troughs, rather than settling into a more stable equilibrium. But viewed over periods of several months or years, the impact on total infection rates will be similar.
Read 9 tweets

Did Thread Reader help you today?

Support us! We are indie developers!


This site is made by just two indie developers on a laptop doing marketing, support and development! Read more about the story.

Become a Premium Member ($3/month or $30/year) and get exclusive features!

Become Premium

Don't want to be a Premium member but still want to support us?

Make a small donation by buying us coffee ($5) or help with server cost ($10)

Donate via Paypal

Or Donate anonymously using crypto!

Ethereum

0xfe58350B80634f60Fa6Dc149a72b4DFbc17D341E copy

Bitcoin

3ATGMxNzCUFzxpMCHL5sWSt4DVtS8UqXpi copy

Thank you for your support!

Follow Us!

:(