James Ward Profile picture
Risk manager + previously covid data analysis & modelling. He / him. 🔶
11 subscribers
Dec 29, 2022 26 tweets 6 min read
When I wrote my thread before Christmas (linked below) I promised you a postscript on the interaction between vaccines and NPIs, so here it is. And it’s good news – the combined effect is more powerful than I expected. 🧵 1/25
Let’s start with what I expected. In an endemic model, with no vaccines, there is essentially a “required” rate of infection which is needed to keep immunity levels topped up at their equilibrium (herd immunity threshold) level. 2/25
Dec 19, 2022 46 tweets 14 min read
So Covid Twitter (and Twitter in general) seems to be dying… with just a few limbs still twitching. To be fair I haven’t been helping much this year, having held true to my New Year’s Resolution to spend time talking to my family rather than on Excel and Twitter. 🧵 So many thanks to those (including but not limited to @BristOliver @PaulMainwood @kallmemeg @john_actuary @chrischirp) who have kept things going this far. But I haven’t completely given up the modelling thing, and there’s a couple of new things I’d like to show you.
Oct 11, 2022 9 tweets 15 min read
@TAH_Sci @i_petersen @karamballes @chrischirp @CathNoakes @MichaelSFuhrer @MichaelPlankNZ I agree our biggest concern right now should be booster take-up in 65+, but I’d be a bit more open to the case for “clean air” interventions. It’s possible that the business case for doing this in some settings actually does stack up, and imo we should be investigating this, … @TAH_Sci @i_petersen @karamballes @chrischirp @CathNoakes @MichaelSFuhrer @MichaelPlankNZ … while being very realistic about the costs and benefits. If we’re happy to start with a basic model (and then refine it) then there’s really only three things we need to work out:
1) what % of transmission do we expect to be interrupted in the specific settings it is used?
Jul 26, 2022 5 tweets 2 min read
really nice analysis from @Jean__Fisch here using the SIREN data to imply changing patterns in the amount of protection that previous infection is giving in each wave. A few points to note:
- infection seems to give strong protection through the autumn 2020 and the Alpha wave - this reduces (through the combined effects of waning, immune escape and impact of vaccinations) for the Delta wave
- and for the first Omicron (BA.1) wave, there appears to be no benefit from prior infection. I don’t believe this is literally true: more likely there was a…
Jun 30, 2022 8 tweets 2 min read
I’ve been looking at this question the other way around, but it’s still very gently encouraging I think. The case curve is continuing with exponential growth (straight line on the log plot) for much longer than we would have liked. We might have expected it to curve over by now …as the effect of growing immunity to the latest variant starts to bring the R number down. We’ve had a couple of false dawns already (what do we call these, they can’t be “dead cat bounces” because we’re still going up… so maybe “live cat slumps”?), but still it keeps rising.
Jun 14, 2022 9 tweets 3 min read
This is important from @AdamJKucharski – and consistent with the maths I outlined in threads about endemicity late last year: (which will have been very familiar territory to Adam and other experts in this field). To draw out a couple of key implications: 1. From a mathematical perspective, the arrival of new variants is a bit like waning host immunity, and has much the same effect (i.e. immunity gets lower). It arrives in a slightly different way (at the same time for everyone, rather than gradually across the population)
Jan 5, 2022 6 tweets 2 min read
Taking a short break from covid data, and on a very personal note, I wanted to pay tribute to my Grandad, Alan Jeffs, who died last Sunday evening at the very grand old age of 96. He led a long and very productive life, and has been an inspiration to me in many ways. (short 🧵) My followers in the aviation world may be interested to know that, after studying engineering at Queen Mary College, London (which was evacuated during WW2 to King’s College, Cambridge – where I later studied), he joined the Power Jets company led by Frank Whittle at Pyestock,…
Dec 31, 2021 20 tweets 6 min read
A quick New Year’s Eve round-up of hospital data, before I disappear for another short break. Two key questions to explore:
1) when and where will the peak in London hospital admissions come?
2) what’s going on in the North East & Yorkshire?
🧵 Growth has definitely slowed in London 18-64 admissions, but it’s not yet peaking in the way that cases appear to be – it looks like the peak will come a bit later. That could be down to any of the following reasons, or some combination of them:
Dec 28, 2021 12 tweets 4 min read
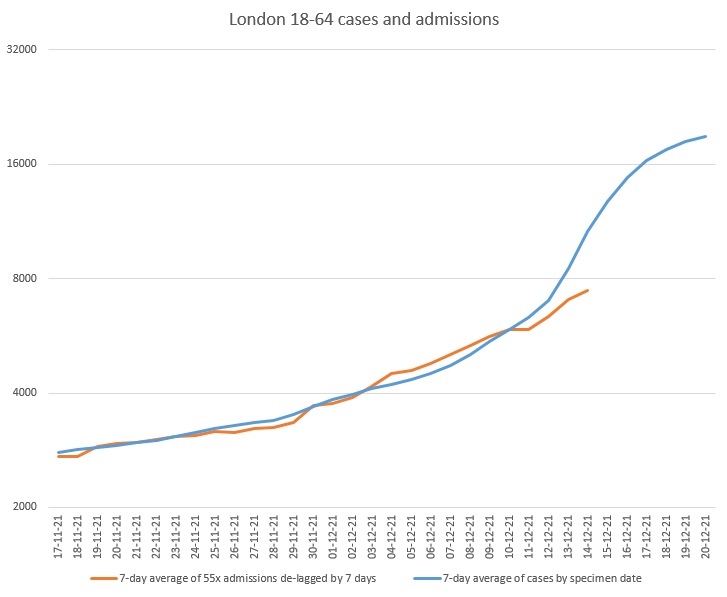
Back briefly from my Christmas break to take a look at the London hospital data. I’d say it’s tending to confirm the patterns we were starting to see before Christmas, which is mostly good news. But there’s still some potentially big risks in the next couple of weeks. 🧵 Firstly, comparing the trends in cases and hospital admissions in the London 18-64s, I think it’s now clear (whatever plausible lag assumption you make) that there is some form of dislocation going on – in a good way i.e. admissions are not rising as fast as cases:
Dec 23, 2021 6 tweets 2 min read
I'll be taking a short break over Christmas (starting tomorrow) so here's a very quick round-up of London hospital data before I go. It's looking slightly better today than yesterday, I think. 🧵 This might be restoring my faith in there being some kind of deviation between the trends for cases and hospitalisations (in London 18-64s). Need a few more days' data to be sure.
Dec 23, 2021 25 tweets 7 min read
I think this is one of those threads that has at least a 50% chance of being deleted before the end of the day, when someone points out I’ve made an embarrassing error in my calculations, or have misinterpreted the meaning of Imperial’s severity analysis. 🧵 But hey, it’s (nearly) Christmas and nothing ventured nothing gained, right? And at least if I’ve got it wrong I’ll learn something in the process. So here goes. I noted in the Imperial report imperial.ac.uk/media/imperial… the following paragraph:
Dec 23, 2021 16 tweets 5 min read
With apologies for delay, here’s today’s round-up of the London hospital numbers. It’s not quite as good news as it was looking a couple of days ago, but there’s still room for hope – particularly in the stats for ventilation beds. I’ll also touch on Imperial & other studies. First up, as usual, a comparison of 18-64 cases and hospital admissions. The flattening we saw before has reversed, and so *maybe* there’s still a bit of deviation there, but maybe there isn’t – it depends a lot on what you assume for a lag from case to admission. 🤷‍♂️
Dec 20, 2021 27 tweets 8 min read
Anyone care for some hopium, at very reasonable rates? I should stress it’s very early days, but there were a couple of positive signs in today’s London hospital data. That doesn’t mean we’re out of the woods, and it could all change in next few days. Let’s take a look… 🧵 Firstly and most significantly, this is the graph of London working-age (18-64) cases and admissions. Until the last couple of days, there was a good fit (with a 6-day lag) between the two. But now the orange line looks like it might be starting to diverge from the blue.
Dec 17, 2021 23 tweets 6 min read
Another round-up of London hospital data. TL;DR: still no clear sign of a changed severity profile for omicron, but it remains early days – while omicron is already dominant in London 18-64 cases, it’s probably only a third of recent admissions and even lower for inpatients. My first graph tracks admissions vs. cases, and there’s still no sign of a deviation from the case trend. Note I’ve slightly changed my lag assumption (to 6 days vs. 7 previously) and I’m conscious that no single fixed lag can properly represent what is really a distribution…
Dec 15, 2021 26 tweets 8 min read
A few thoughts on London hospital data. TL;DR: so far, there’s no obvious sign of a different severity profile for omicron cases (vs. our recent experience of delta), but it’s early days yet, and we need to keep watching this data very closely. 🧵 Firstly let’s look at admissions and how they relate to cases. I’m focusing here on admissions in the 18-64 age category because we know that’s where omicron has been spreading most rapidly, and hence where we’re most likely to see an omicron-related signal.
Dec 14, 2021 52 tweets 13 min read
Another week, another long thread on omicron. This time, I’m still concerned, but perhaps a bit less worried than I was – mainly because I’m starting to be more confident that our experience of omicron will be significantly milder than earlier covid waves. 🧵 Most of what I said in last week’s thread (see below) remains true. And I was somewhat gratified to see that the great minds at @cmmid_lshtm, using far more computer power than the back of my envelope can provide, came to very similar conclusions:
Dec 5, 2021 44 tweets 10 min read
I’ve been cautious about saying much about omicron but I think it’s getting into the space where I can add something. And what I’d like to say is: despite the encouraging signs from South Africa that the omicron wave is milder than those that came before, I’m still worried. 🧵 The reason for this is essentially our old favourite: multiplying a very large number by a small percentage can still give you a pretty large number. There’s a view that omicron won’t be a big problem because severe disease protection will hold up well,
Nov 30, 2021 9 tweets 3 min read
it's a while since I've given you the age breakdown of English cases (sorry, it's been a busy couple of weeks at work and at home). and it's looking OK I think: overall cases are pretty flat, maybe even slightly falling. and the falls continue where it matters most (in 60+) 🧵 Image digging into the detail, starting with the younger age groups: these now all look fairly stable, maybe just slightly over the peak. (and note I'm being cautious by truncating 3 days on the specimen date series - the next day looks slightly better again, on a sneak peek). Image
Nov 18, 2021 4 tweets 2 min read
only three graphs today: one bad, and two good (which is probably a fair summary of how I'm feeling). firstly the bad: cases in 5-9s appear to have hit an all-time high, which isn't ideal: 1/4 Image the better news is that growth seems to be fading in the younger age groups (but with cases still growing, for now at least), and cases are already falling in the older (60-80 and 80+) age groups: 2/4 Image
Nov 13, 2021 9 tweets 3 min read
Honestly not a big fan of the case trends in the last couple of days. Here’s the overview: with the kids still driving the growth, but other groups also starting to pick up. (and I wouldn’t take too much cope from the flattening on the last day – that will get revised up) 🧵 Looking in more detail at the under-20s, we can see the power coming from the 5-9s, but with 0-4 and 10-14 not far behind, and even 15-19s now back into positive territory (i.e. cases growing)
Nov 11, 2021 12 tweets 4 min read
The headlines from today’s case data are concerning, and it’s certainly not great news. But there are some glimmers of hope in the detail by age, so let’s have a dig in. The overview doesn’t look too bad, with case rates stable in the under-40s, and still falling in the 40+ 🧵 Image But that is a slightly lagged view of what’s going on, and obscures some useful detail. So I’ve built some new graphs which break down each of those lines into 5-year age groups, with no averaging, and using data up to specimen date 9th Nov – NB this date will get revised up.