Just had another look at back calculating R (Covid infection rate) from hospitalisations as well as from deaths and recorded infections. I think I've got it now.
Hospitalisation requirements change, treatments change, testing regimens change with capacity and surge testing, I'm quite surprised the three calculations align as well as this
What does this tell us? Well, to line up R from hospital admissions we need to go eleven days back. That fits in well with the ONS data saying 6 days, especially for older folks, after showing symptoms (on average 5 days after infection). So peak hospitalisation is 11 days
Whereas peak time to get a test result reported is 8 days after infection - thats what you need to use to line R from infections up with R from deaths (deaths don't lie, its the most tragically unambiguous data point)
...or in other words peak time for symptoms is 5 days, it takes a day or two to get tested and a result logged, so peak test result is day 8, and peak hospitalisation is day 11. Peak day to die is, as we already know, 18 days after symptoms, 23 days post infection.
Pondering what else I can get out of the data adding hospital admissions into the mix. Ideas?
Was thinking about this over lunch (see thread). If peak time to get a test result is 8 days, and peak time for hospitalisation is 11 days, then from that you can work out hospitalisations as a percentage of recorded cases. And thats a wild looking graph.
Settling down now to 0.1% of cases, more or less, ending up in hospital. Thats a result both of mass testind and vaccines.
• • •
Missing some Tweet in this thread? You can try to
force a refresh
Overall Covid scenario in the UK isn't looking good. Its not all bad, but we're hitting some desperately grim milestones right now. Here's the overall picture. Strap in. This is gong to take some working through (1)
Deaths and cases are rising exponentially, but not on the same exponent. There is no such thing as an exponential rise in either thats not terrible news though (2)
37 deaths today is the highest single day total since St. Georges day, and the 7 day rolling average is over 20 now for the first time since the 29th of April. An exponential rise means things get worse at a proportionally constant speed - 1,2,4,8,16,32... (3)
I don't think positive tests will rise at the same rate today as we've seen previously, because last Monday we saw catch-up data missed on Sunday. On that trend we'd see 37625 to 38221 cases (1)
...but anything over 22868 is a rise. We could well go over 30k in a day for the first time. (2)
The monday lag means deaths should be low. 3-4 deaths would be on trend. Last Monday we saw 3 (3)
The problem for the government with mask wearing is that they are dogmatically individualistic in themselves but innately prejudiced against others. They don't believe in collective responsibility among themselves, but the DO hold others collectively responsible...
...see for reference governments treatment of immigrants. So the idea that we each do something to ensure the safety of everyone? Thats anathema to the modern Tory ideology. There are no One Nation Conservaties now...
...person A does something good of persons B, C, D, E and F, thats clearly a good thing. Tory ideology is persons B, C, D and E are responsible to doge what Person A does, not the other way round...
I won't post a full Covid stats thread today, but I'll go over roughly where we are. I'll start with cases. We've reached a staggering 173662 cases over the last 7 days. 24809 a day. Thats the highest since the 30th of January (1)
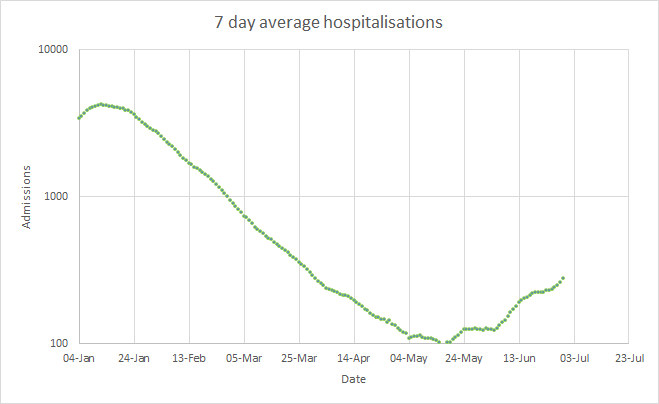
The most recent data we have for hospitalisations is from the 29th of June. Thats 358, the highest since the 23rd of March. Admissions are rising exponentially. (2)
We've had 122 Covid deaths over the last 7 days. The trend is, well, unimstakably upwards - you'd have to be very optimistic to look at rising cases and hospitalisations and maintain otherwise because of a spike in deaths a week ago (3)
Ghastly Covid data in the UK today. Just ghastly. 18270 infections, 23 deaths. Here's the overall picture before getting into the details. (1)
Deaths over trend, not massively so but any trend of increasing deaths is awful. Cases over trend again - they're increasing ever faster. Look at the two on log plots (2)
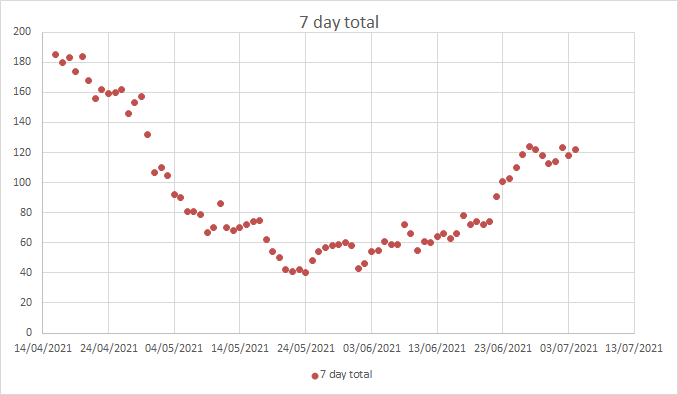
If you just look at he 7 day rolling totals its pretty clear how grim this is now. That was 60 two weeks ago, 74 a week ago, 115 now. (3)
I'm not saying I want politicians to be monks. If they're polyamorous thats their business. But there must be standards in public life, and this needs to be out in the open. I would remind you that Johnson himself went to court to try to hide how many illegitimate children he has
...this isn't polyamory. This is dishonest philandering and corruption. Its not having open relationships, its breaking your own rules during lockdown.
...across the UK people were doing their best to avoid catching or spreading Covid. And the trajectory of cases and deaths we're on means more such measures may be needed. @MattHancock knows this...