The latest @ICNARC report on COVID intensive care activity has been published. It's more comprehensive than ever, so this short thread focuses on recent admission trends. (Outcome data is little changed, being second wave totals.)
Of 536 admiss'ns in June, 43% were in the NW.
1/
Of 536 admiss'ns in June, 43% were in the NW.
1/

536 admissions over a month is still a fraction of the volumes seen at the start of the year, but nevertheless, the recent increase can be seen here. It's a slower rise too, which will be the result of vaccinations (of which more later).
2/
2/

Another reason why the national increase has been slower is it's mainly been concentrated in just one area. You can see here the rise in the NW, compared with figures that, at least so far, barely register in other regions.
3/
3/

The proportion of general COVID admissions becoming an ICU admission jumped suddenly in June to its highest level since April 20, (although has fallen back slightly again). We saw a similar increase at the start of the second wave too.
4/
4/

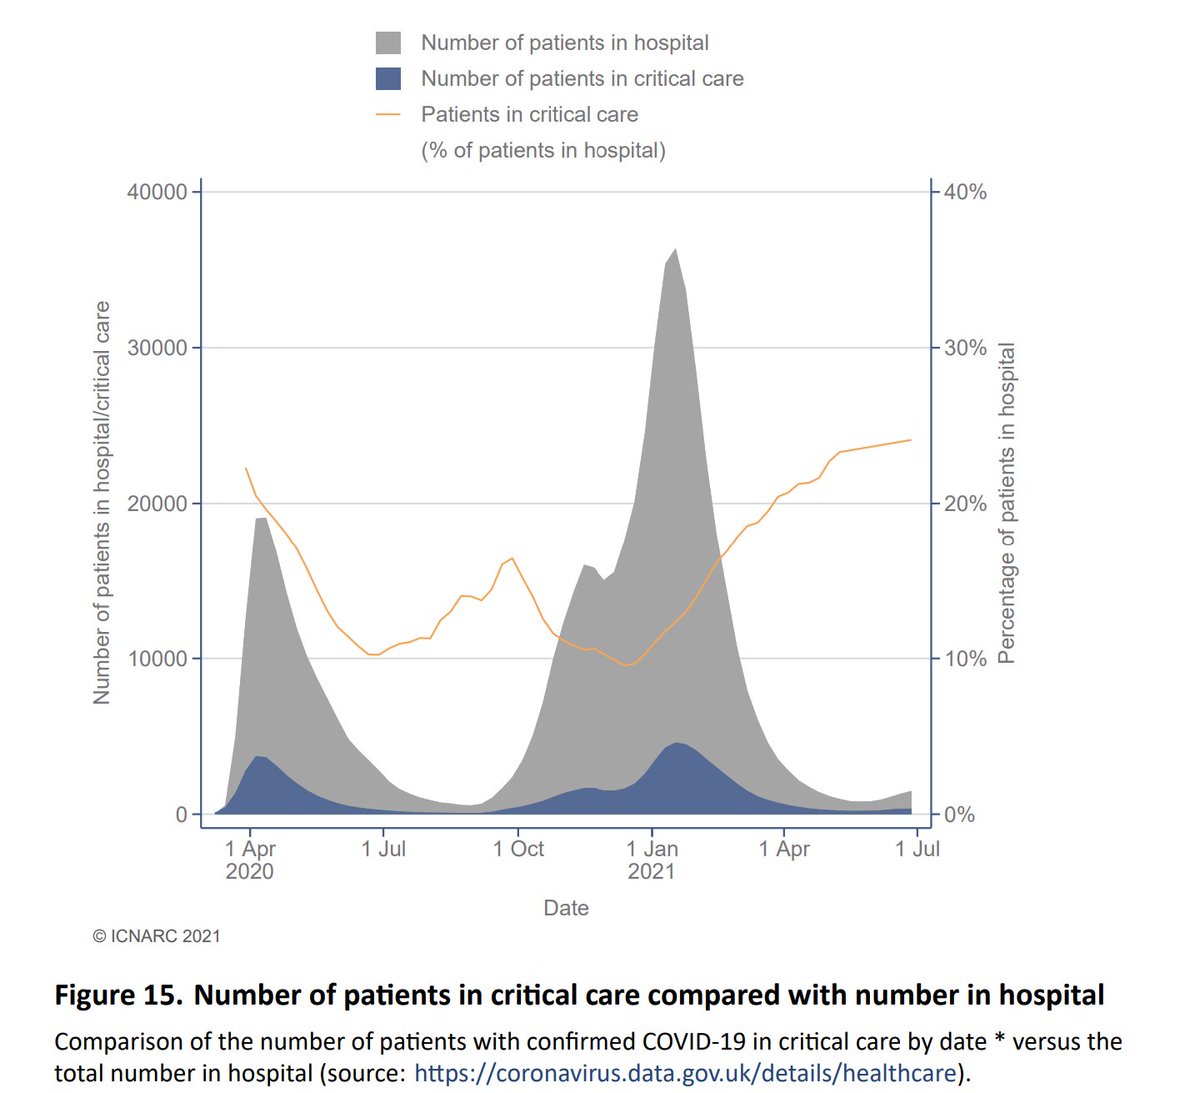
Turning to numbers in critical care at any time (as opposed to admissions), we can see how the second wave topped the first, and was longer too. Again, the decline has been reversed, albeit the increase is slower than we saw in the autumn as the second wave took hold.
5/
5/

Of interest, the relative proportions of critical care beds occupied is at its highest, nearly 25%. This might suggest that many non-ICU patients are having shorter stays, thus limiting the increase in general beds?
6/
6/
Most patient demographic data is still aggregated from the start of the second wave. You can see here the age distribution over that period. We would expect though that as vaccination worked down the age groups, this would have changed....
7/
7/

... and in the top graph here, we can see how the older age bands have reduced as a proportion of the total admissions, reflecting the move to a younger age distribution.
8/
8/

Indeed, the mean age has fallen from around 60 by 10 years over the period of the vaccination roll out. Note though that it appears to have stopped falling, and may be starting to rise again. This is to be expected once all adults have had the opportunity to be vaccinated.
9/
9/

Analysing by vaccine priority group, we can see the relatively faster fall in the first groups (1-4 and 5-9) as the programme took effect. Although they are now starting to increase again, as are those for the balance (under 50s).
(Note this is a log scale graph.)
10/
(Note this is a log scale graph.)
10/

Here we see how 28 day mortality is higher during peak periods of pressure, and reduces as capacity improves. It's good to see the most recent data points at their lowest, albeit that the fall does appear to have levelled off.
11/
11/

As noted much of the outcome data is aggregated, so has changed little of late. In summary though, 41% of those who entered critical care in the second wave died, 56% were discharged to continue their recovery at home, and 3% remain in hospital.
12/
12/

At 112 pages, I've only scratched the surface here, and the extent of the data is hugely impressive, so a big shout out to all of those involved in collecting and analysing it.
13/
icnarc.org/Our-Audit/Audi…
13/
icnarc.org/Our-Audit/Audi…
And finally, a big thank you to all intensivists and indeed other hospital and health and care staff for their continuing efforts to protect and care for so many patients over the last 16 months. Thank you!
14/14
14/14
• • •
Missing some Tweet in this thread? You can try to
force a refresh