
Forecasts from large investment banks have been increasingly bullish on oil lately, with Goldman Sachs and Bank of America calling for $80-$100 oil prices recently. What changed between last years oil price crash and today? Thread below 👇 🛢🧵
One of the major reasons that the narrative on crude oil has become more bullish is that the latest reports on crude inventories show a rapidly tightening market, well beyond prior expectations. (1/19)
Oil production has risen much slower than oil demand, which has nearly returned to pre-pandemic levels, causing a major decrease in crude oil inventories in recent months.(2/19) 

Oil inventories help illustrate the supply side of crude oil fundamentals. Weekly crude oil inventory reports show current storage levels and the difference between production and consumption over a given period. (3/19)
Inventories build when production>consumption in the previous period and decrease when consumption>production. When oil stockpiles are much lower than historical averages or are rapidly drawn down, we’re more likely to see steep oil price increases. (4/19)
U.S. crude inventory numbers are released on a weekly basis by the U.S. Energy Information Administration (EIA) and American Petroleum Institute (API), both of which have shown crude inventories falling steeply in the past 6 weeks. Chart source: EIA (5/19)

API reported that crude inventories fell by 8MM bbls for the week ended July 1, following a draw of 8.2MM barrels in the previous week. EIA’s report showed a crude inventory draw of 6.9 MM bbls for the week ending July 2, following a 6.7 MM bbl draw for the previous week. (6/19)
Both agencies reports exceeded analyst expectations of a 4-MM-bbl decrease in crude oil inventories for the week. (7/19)

The rate of recent inventory drawdowns has been remarkable as well. The EIA reported that over the last 4 weeks, total crude inventories have fallen at a rate of nearly 1.2m barrels per day, or the largest 4-week stock drawn on rolling data going back almost 40 years. (8/19)
At 445.5 million barrels, U.S. crude oil inventories are 7% below the 5-yr average for this time of year. The excess crude oil inventories, built up in 2020 during the COVID-19 economic pause, have been depleting at an exceptional pace, signaling a tighter physical market. (9/19)
Another indication of a tight market is the steepening backwardation exhibited in the crude oil futures curve. Futures contracts illustrate what people are willing to pay today for barrels at a future date. (10/19)
In backwardation, spot prices hold a premium to future prices, and inventories are typically drained for immediate use. In contango, spot prices are at a discount, and it’s more economic to store barrels to sell later. (11/19)
In the WTI Cal 2022-2026 Futures Curve chart, we can see that the forward curve is in steep backwardation and has shifted down in recent weeks. This tightening in the physical market has contributed to a sustained appreciation in crude oil prices over the last few months. (12/19)
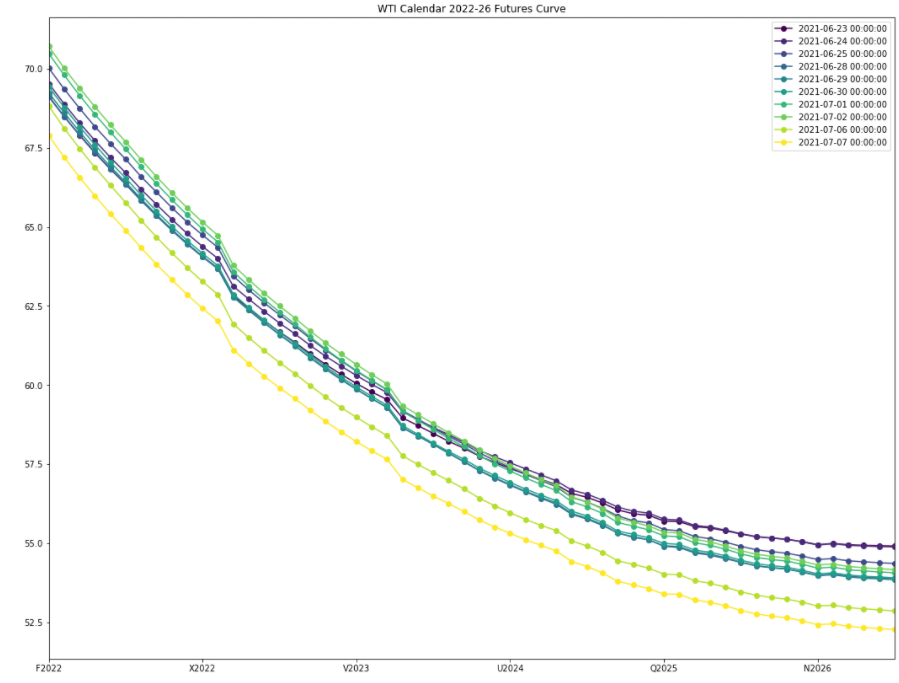
WTI prices have remained above the $70 mark continuously since 6/10/2021, and above $65 since 5/24/2021. This week, WTI briefly exceeded $75 per barrel on Tuesday July 6th, touching highs not seen since November 2014, before pulling back to $72 on Thursday July 8th. (13/19)

Historical evidence suggests that an oil price in the $65-75 range would incentivize producers to bring additional barrels online, however, today’s oil and gas landscape is different than that of the past. (14/19)
It’s true that many recent potential oil price rallies have been thwarted by the “drill baby, drill” mentality of U.S. shale producers, but so far in 2021, we have seen North American publicly traded E&P companies exhibit far more capital discipline. (15/19)

This is likely a response to shareholder concerns after years of capital destruction, and we will see how much longer North American E&Ps can remain composed in this high-priced environment. (16/19)
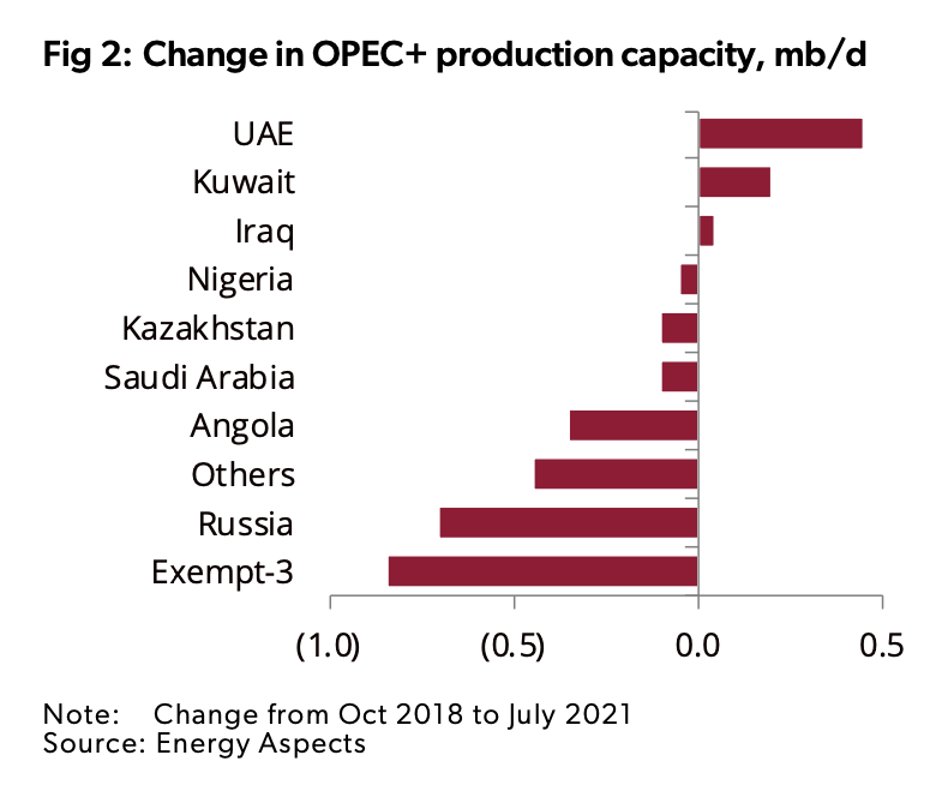
Additionally, there may be more difficulty ramping up production materially for OPEC & Non-OPEC producers next year. Capital starvation in the O&G sector since the 2014 downturn has resulted in a lack of investment in oil production and infrastructure over the last decade (17/19)
This substantially decreases likely global reserves and production capacity. Also, we believe OPEC+ spare capacity could be less than advertised, and may not be enough to satiate increasing demand - Bison may investigate this in another analysis. (18/19)
The end result of this inventory analysis: a convergence of factors have left the market tighter and more susceptible to rapid price increases than in prior years. (19/end)
If you enjoyed this read, please feel free to check out the full version for free on our website, where you can find our in-depth research and content at no cost.
bisoninterests.com/content/f/oil-…
bisoninterests.com/content/f/oil-…
• • •
Missing some Tweet in this thread? You can try to
force a refresh


