1/ Understanding Commercial Real Estate: Just How Different from Housing Is It? (Gyourko)
"The correlation between owner-occupied and commercial real estate is 40%. Both exhibit persistence across individual years and mean reversion over longer periods."
papers.ssrn.com/sol3/papers.cf…
"The correlation between owner-occupied and commercial real estate is 40%. Both exhibit persistence across individual years and mean reversion over longer periods."
papers.ssrn.com/sol3/papers.cf…

2/ "The use of common production technologies and factors of production such as land and capital probably makes it difficult to prevent pricing in one property sector from influencing values in another within the same market area."
3/ "The market capitalization of the equity REIT sector was under $7 billion until the early 1990s, so it is only over the last 15-20 years that this market is thought to be a reasonable proxy for commercial property markets. This paper uses data compiled by NAREIT.
4/ "Equity REITs have had an average debt-to-equity ratio of about 1-to-1 over the long run.
"That NCREIF prices are ‘stale’ suggests that the NAREIT series leads NCREIF, which has been confirmed in previous research.
"That NCREIF prices are ‘stale’ suggests that the NAREIT series leads NCREIF, which has been confirmed in previous research.
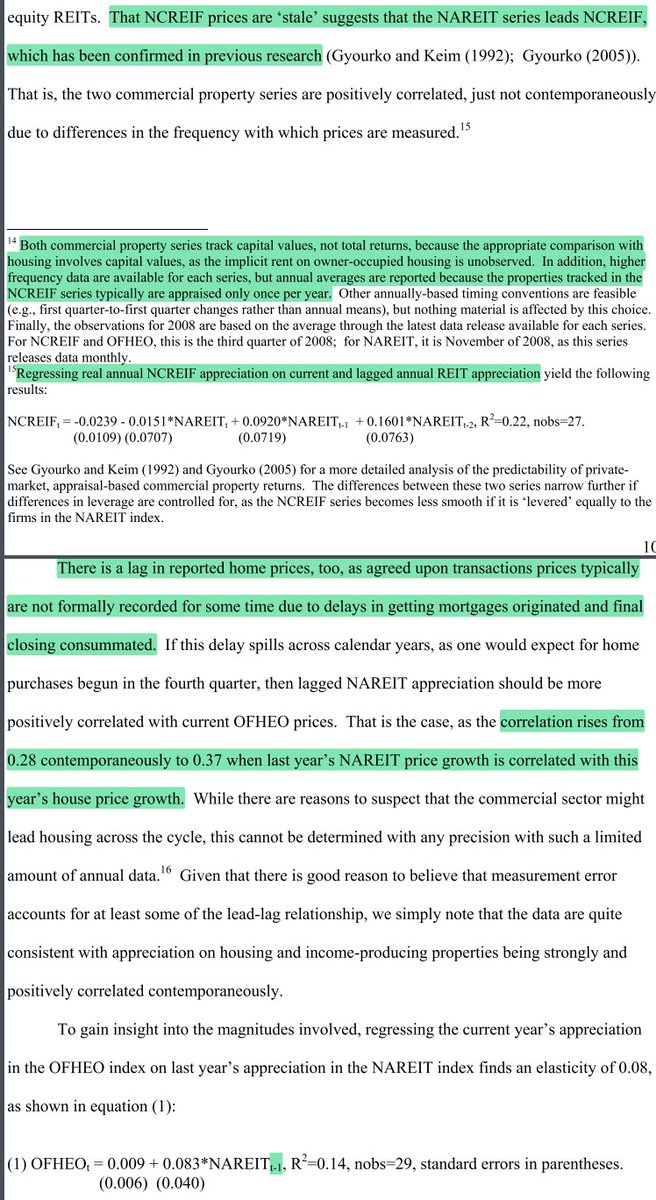
5/ "There is a lag in reported home prices, too, as agreed-upon transaction prices are not formally recorded for some time.
"The correlation rises from 0.28 contemporaneously to 0.37 when last year’s NAREIT price growth is correlated with this year’s house price growth."
"The correlation rises from 0.28 contemporaneously to 0.37 when last year’s NAREIT price growth is correlated with this year’s house price growth."

6/ "Changes in price-to-construction cost ratio are interpreted as primarily reflecting changes in implied land values.
"If implied land values in the housing sector rose a lot during 2003-08 in a given metro area, they also tended to rise a lot in that area’s office sector."
"If implied land values in the housing sector rose a lot during 2003-08 in a given metro area, they also tended to rise a lot in that area’s office sector."


7/ "The commercial market has been much more volatile and often experiences sharp drops in nominal prices. Longer lead times in the production of income-producing properties may help explain this.
"The volatility is apparent in the summary statistics in the bottom of Table 1."
"The volatility is apparent in the summary statistics in the bottom of Table 1."

8/ NOTE: The standard deviations for the OFHEO (single-family home) and NCREIF indices are probably artificially low due to infrequent appraisals and the way appraisals are conducted (smoothing of returns over several months and dropping distressed sales).
https://twitter.com/ReformedTrader/status/1287510087532072960

9/ "As many people have noted, there never was a nominal downturn in aggregate national house prices until 2008. However, Figure 3 documents several inflation-adjusted declines.
"Real constant-quality house prices fell by 12% between 1979 and 1982 and 6% between 1989 and 1994."
"Real constant-quality house prices fell by 12% between 1979 and 1982 and 6% between 1989 and 1994."

10/ "Total returns on commercial real estate have been much stronger over time, largely because of a consistently large net rental flow.
"Appraised capital values tend to fall in real terms whenever rent growth decelerates, especially when it turns negative."
"Appraised capital values tend to fall in real terms whenever rent growth decelerates, especially when it turns negative."


11/ "A 1% higher appreciation rate last year is associated with a 0.17% higher rate this year, controlling for national conditions and the local trend. This is less than the 0.2-0.5 reported for owner-occupied housing by Case and Shiller, but both exhibit short-run persistence."


12/ "The second panel indicates that persistence in appreciation, income growth, & total returns weakens rapidly.
"The variation in total returns is driven by volatility in capital values: results for total returns and capital appreciation are similar (compare columns 1 & 3).
"The variation in total returns is driven by volatility in capital values: results for total returns and capital appreciation are similar (compare columns 1 & 3).
13/ "Rents are smooth compared to property values. This makes commercial real estate like stocks: total returns are driven more by changes in multiples than by changes in rents."
This is consistent with what Demers & Eisfeldt find for single-family homes:
This is consistent with what Demers & Eisfeldt find for single-family homes:
https://twitter.com/ReformedTrader/status/1405171646227357699
14/ "Nearly two-thirds of the variation in real annual appreciation and real total returns can be explained by year dummies, with over 80% of the variation in real annual income growth being common across markets. Market dummies can only account for 3%-4% of the variation."

15/ "This is different from what Glaeser & Gyourko report for owner-occupied housing: year-fixed effects could explain only 27% of the variation in real annual house price changes between 1980-2005 for 115 metropolitan areas. Single-family housing markets appear to be local."
16/ "The bulk of the price appreciation experienced in the hottest office markets from 2003-2008 was due to multiple expansion (falling cap rates), not higher net rents."


17/ Value & Momentum Everywhere
Best Strategies for Inflationary Times
Total Returns to Single Family Rentals
Demystifying Illiquid Assets: Expected Returns for Private Real Estate
https://twitter.com/ReformedTrader/status/1190258717779849216
Best Strategies for Inflationary Times
https://twitter.com/ReformedTrader/status/1379196109730410496
Total Returns to Single Family Rentals
https://twitter.com/ReformedTrader/status/1393989847417647106
Demystifying Illiquid Assets: Expected Returns for Private Real Estate
https://twitter.com/ReformedTrader/status/1287504178076557312
• • •
Missing some Tweet in this thread? You can try to
force a refresh