Scuola primaria: esiti sostanzialmente stabili rispetto al 2019, ma notevole differenza tra scuole e tra classi nel Mezzogiorno e il resto del paese
Terza media: aumentano del 5% gli studenti che NON raggiungono livelli di accettabilità in Italiano 

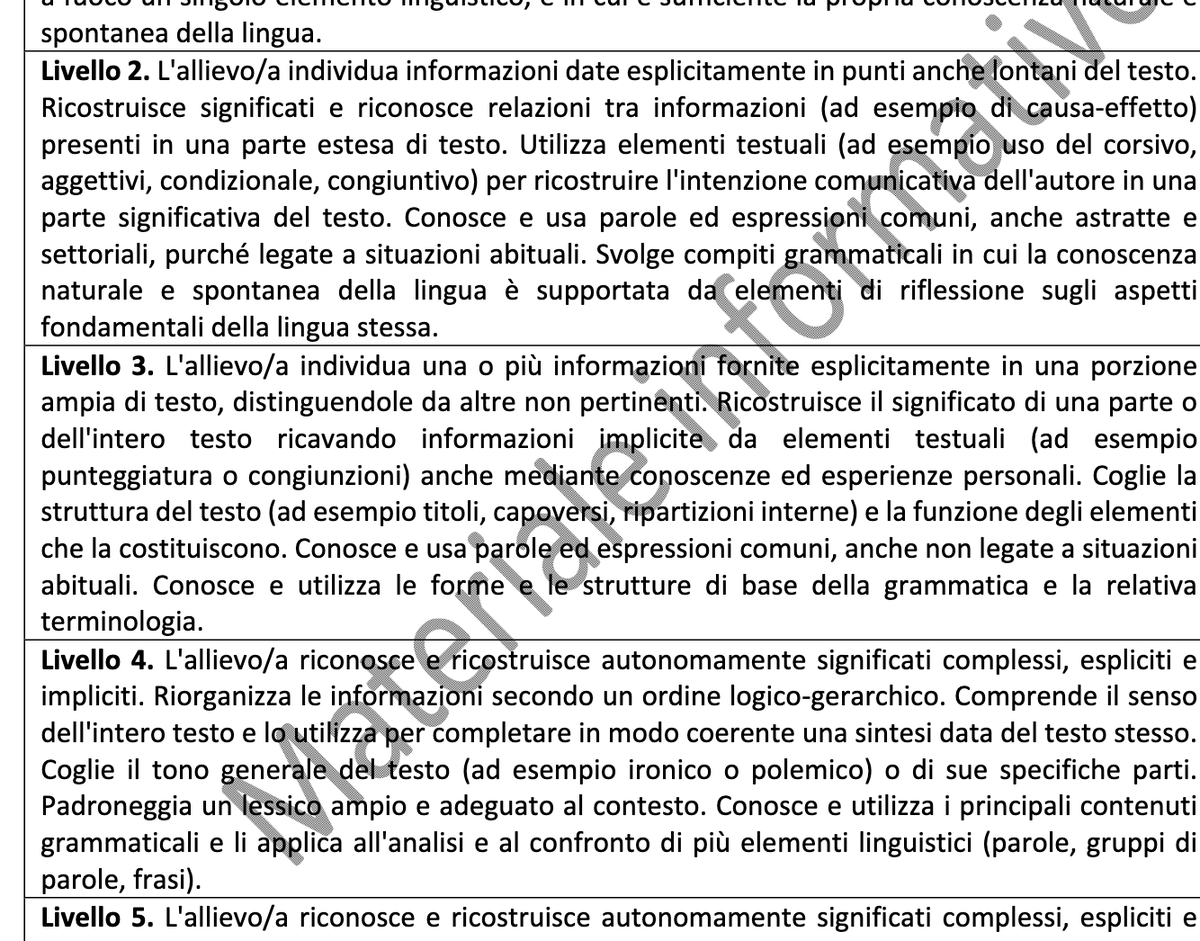
E cioe' non riescono a raggiungere il livello 3 descritto qui. Da leggere attentamente specialmente per chi sostiene che la complessità della scuola non si può ridurre a dei dati. invalsi-areaprove.cineca.it/index.php?get=…
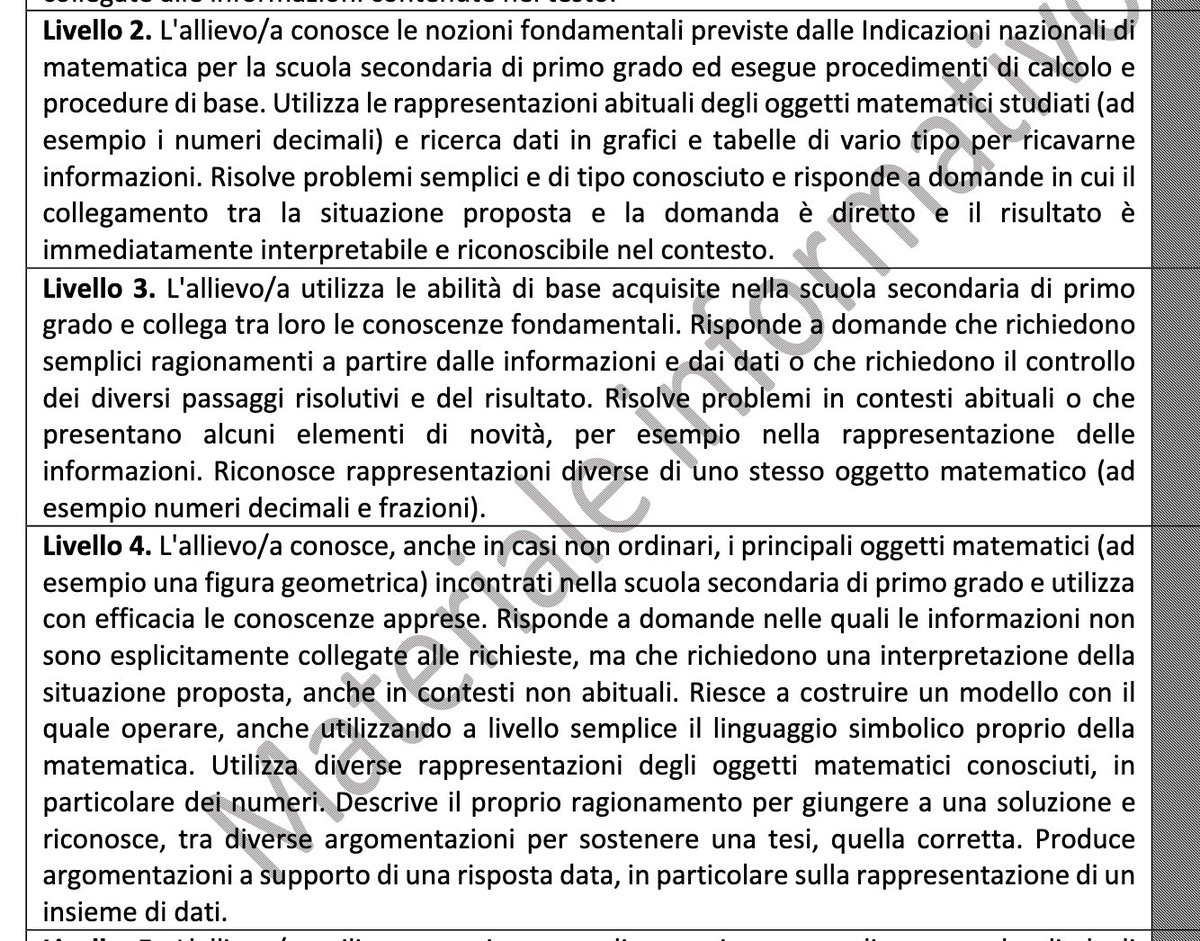
... e aumenta del 6% chi non riesce a raggiungere l'accettabilità in Matematica (più del 50% al sud)!

E cioè non riesce a raggiungere il livello 3 descritto qui. Altro pane per i denti di quelli che "eh ma l'istruzione non si fa con i test a crocette"
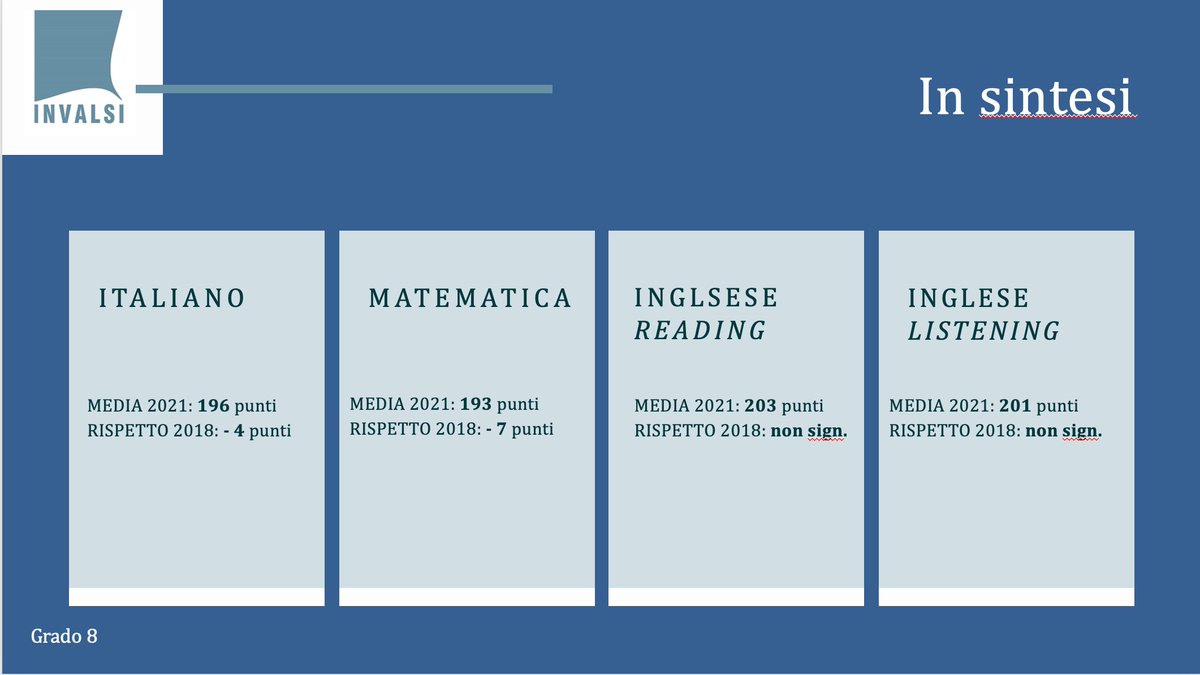
@Invalsi_social forse sarebbe meglio mettere i valori in termini di standard deviations piuttosto che di "punti"
Il peggioramento dei risultati è maggiore fra chi proviene da famiglie svantaggiate. Risultati simili a quelli della terza media per le quinte superiori @monacelt @albertobisin @CarloStagnaro @DeShindig @ricpuglisi @brusco_sandro @RickDuFer @CristinaDragani @vitalbaa n/n
Perfetta chiosa al thread:
https://twitter.com/Tboeri/status/1415316159914823682?s=20
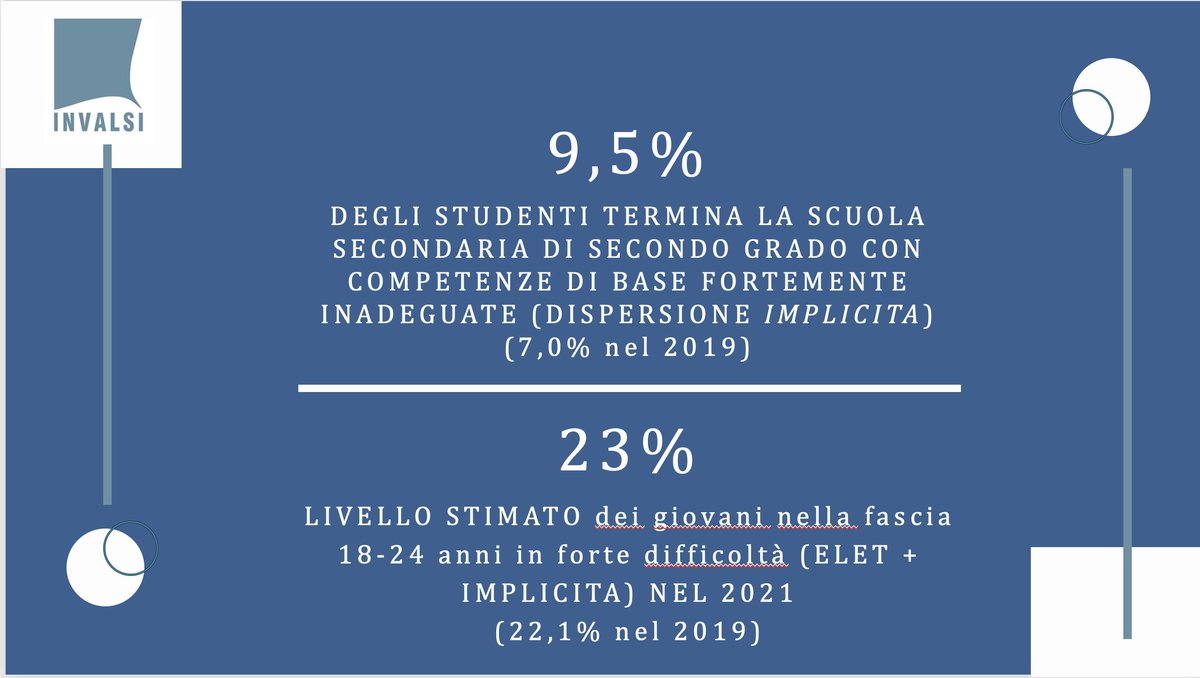
@monacelt @albertobisin @CarloStagnaro @DeShindig @ricpuglisi @brusco_sandro @RickDuFer @CristinaDragani @vitalbaa addendum che mi era sfuggito. La percentuale di studenti che termina la scuola secondaria con competenze fortemente inadeguate (in tutte e 4 le materie: italiano, matematica, inglese scritto e comprensione) e' aumentato dal 7% al 9.5% con forti differenze regionali.

@monacelt @albertobisin @CarloStagnaro @DeShindig @ricpuglisi @brusco_sandro @RickDuFer @CristinaDragani @vitalbaa addendum che mi era sfuggito. La percentuale di studenti che termina la scuola secondaria con competenze fortemente inadeguate (in tutte e 4 le materie: italiano, matematica, inglese scritto e comprensione) e' aumentato dal 7% al 9.5% con forti differenze regionali

Il che significa che la percentuale di studenti senza competenze minime di base arriva a quasi 1/4 con punte regionali vicine al 40%

ah e l'invalsi ha anche un altro account! @INVALSIopen @R_Ricci_INVALSI
• • •
Missing some Tweet in this thread? You can try to
force a refresh