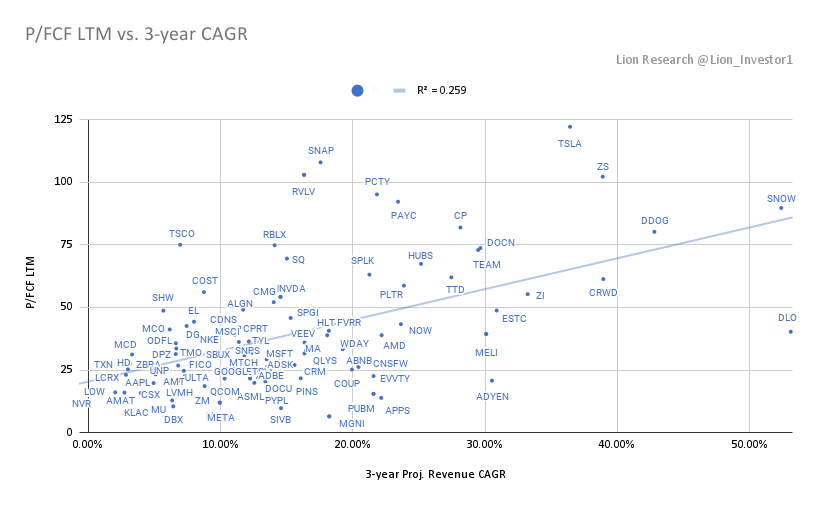
After a few volatile days, it is a good time to assess where current valuation multiples stand and the estimates of revenue CAGR for the next few years.
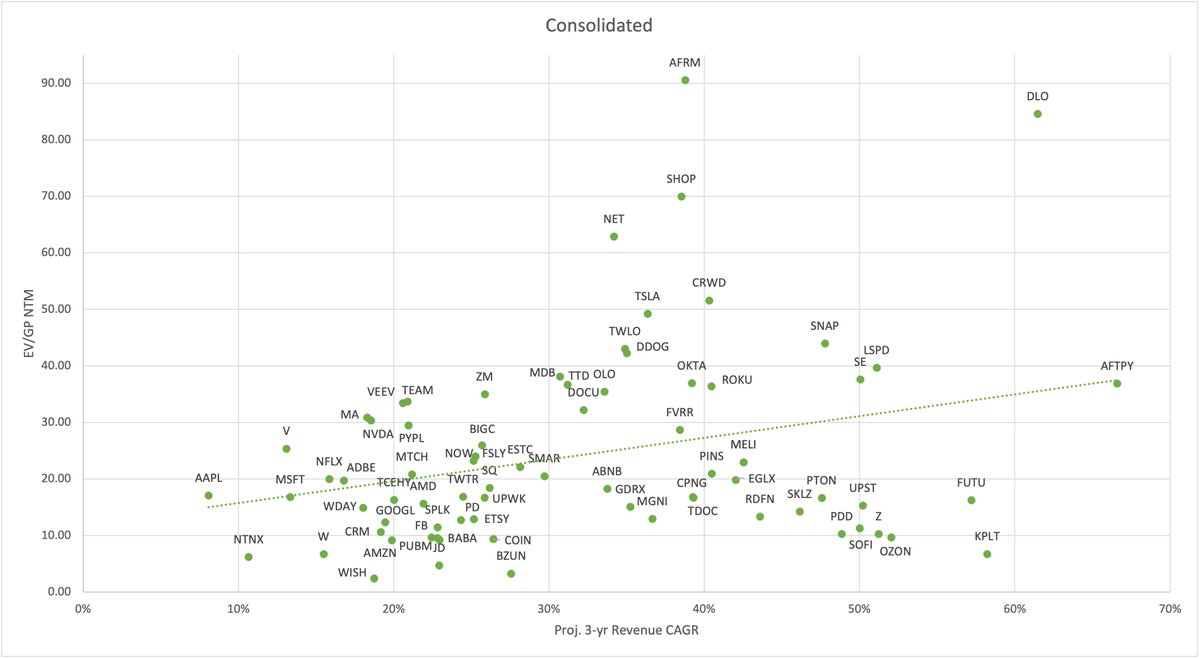
This is the consolidated graph with all the companies. The next graphs are grouped by industry.
This is the consolidated graph with all the companies. The next graphs are grouped by industry.
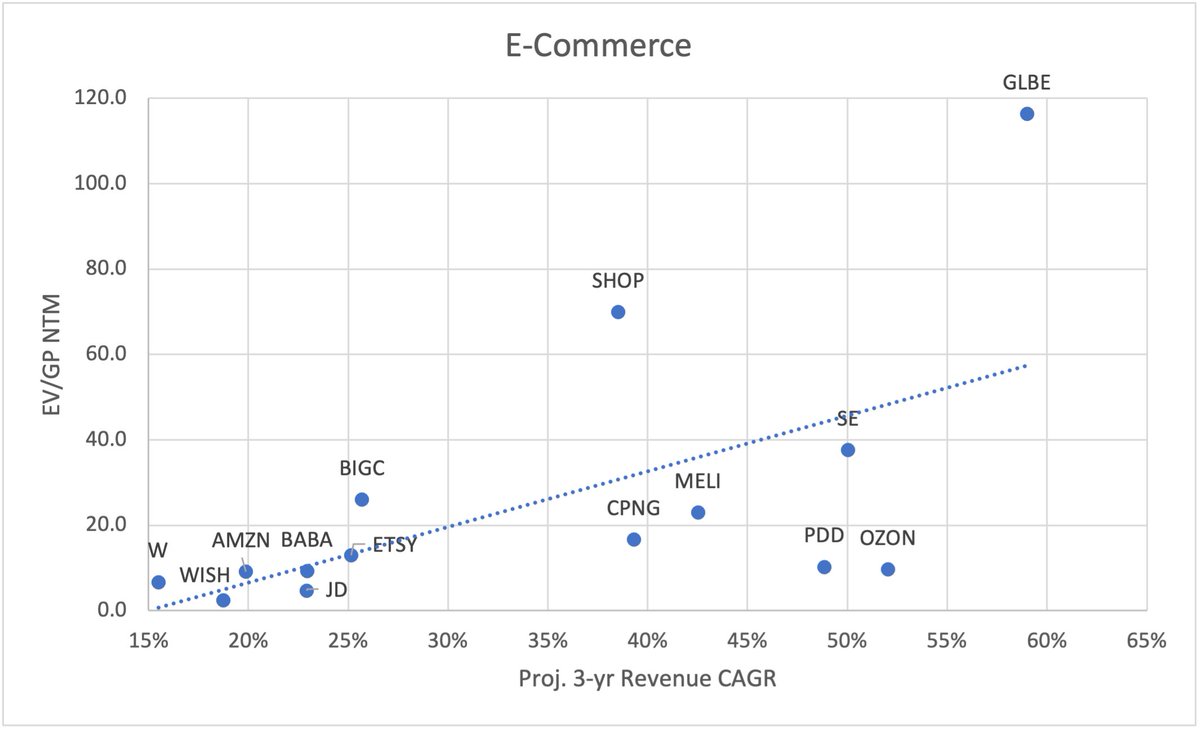
E-Commerce
EV/GP NTM and EV/EBITDA NTM (for profitable Cos)
$AMZN 9.1x / 23.6x
$BABA 9.2x / 17.5
$SE 37.6x / 152x
$MELI 23x / 202x
$JD 4.7x / 34x
$W 6.7x / 34x
$SHOP 70x / 499x
$CPNG 17x
$ETSY 13x / 33x
$PDD 10x
$OZON 9.6x
$BIGC 26x
$WISH 2.4x
$GLBE 116x
EV/GP NTM and EV/EBITDA NTM (for profitable Cos)
$AMZN 9.1x / 23.6x
$BABA 9.2x / 17.5
$SE 37.6x / 152x
$MELI 23x / 202x
$JD 4.7x / 34x
$W 6.7x / 34x
$SHOP 70x / 499x
$CPNG 17x
$ETSY 13x / 33x
$PDD 10x
$OZON 9.6x
$BIGC 26x
$WISH 2.4x
$GLBE 116x
Fintech and Payments
$V 25x / 29x
$MA 31x / 35x
$PYPL 29x / 44x
$SQ 18x / 115x
$AFTPY 37x / 196x
$COIN 9.4x / 21x
$AFRM 90x
$SOFI 11x / 113x
$UPST 15x / 139x
$FUTU 16x
$LSPD 40x
$DLO 85x
$KPLT 6.7x / 53x
$V 25x / 29x
$MA 31x / 35x
$PYPL 29x / 44x
$SQ 18x / 115x
$AFTPY 37x / 196x
$COIN 9.4x / 21x
$AFRM 90x
$SOFI 11x / 113x
$UPST 15x / 139x
$FUTU 16x
$LSPD 40x
$DLO 85x
$KPLT 6.7x / 53x

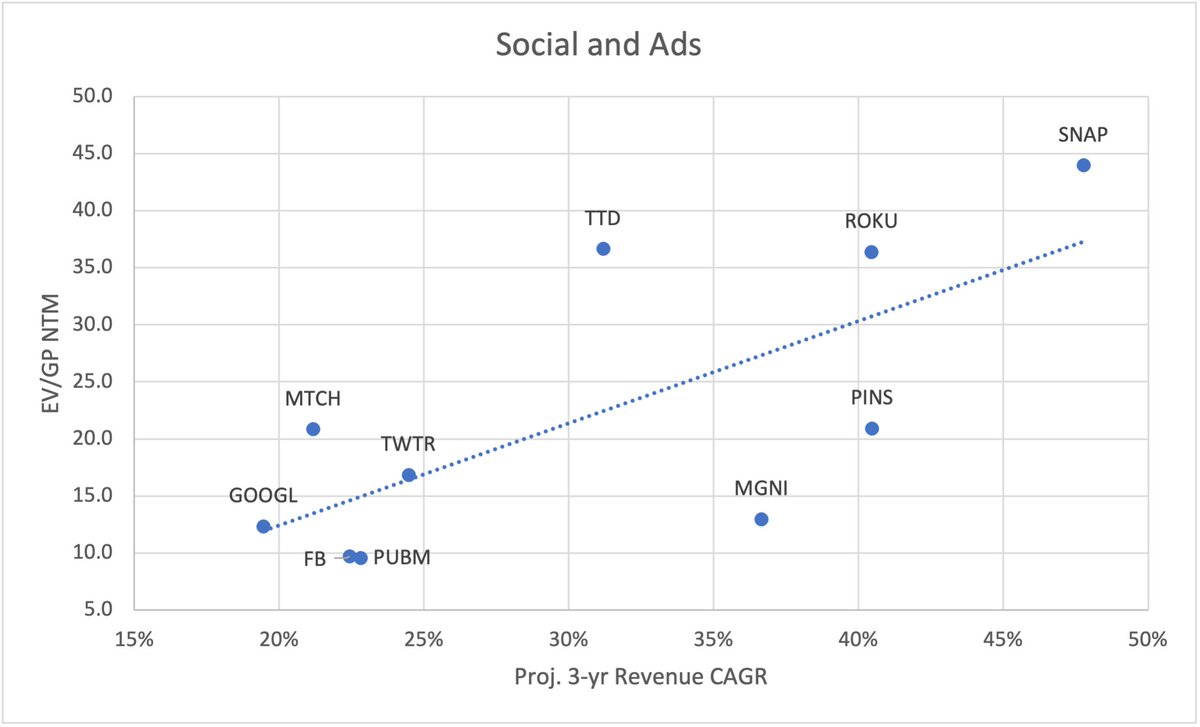
Social Media and Digital Ads
$FB 9.7x / 14.8x
$GOOGL 12.3x / 17.3x
$PINS 21x / 63x
$SNAP 44x / 191x
$TWTR 17x / 37x
$ROKU 36x / 248x
$TTD 37x / 84x
$MTCH 21x / 41x
$MGNI 13x / 29x
$PUBM 10x
$FB 9.7x / 14.8x
$GOOGL 12.3x / 17.3x
$PINS 21x / 63x
$SNAP 44x / 191x
$TWTR 17x / 37x
$ROKU 36x / 248x
$TTD 37x / 84x
$MTCH 21x / 41x
$MGNI 13x / 29x
$PUBM 10x
Mega Cap
$AAPL 17x / 22x
$MSFT 17x / 23x
$GOOGL 12x / 17x
$AMZN 9.1x / 24x
$FB 9.7x / 15x
$TCEHY 16x / 20x
$BABA 9.2x / 17.5
$TSLA 49x / 61x
$NVDA 30x / 46x
$NFLX 20x / 37x
$AAPL 17x / 22x
$MSFT 17x / 23x
$GOOGL 12x / 17x
$AMZN 9.1x / 24x
$FB 9.7x / 15x
$TCEHY 16x / 20x
$BABA 9.2x / 17.5
$TSLA 49x / 61x
$NVDA 30x / 46x
$NFLX 20x / 37x

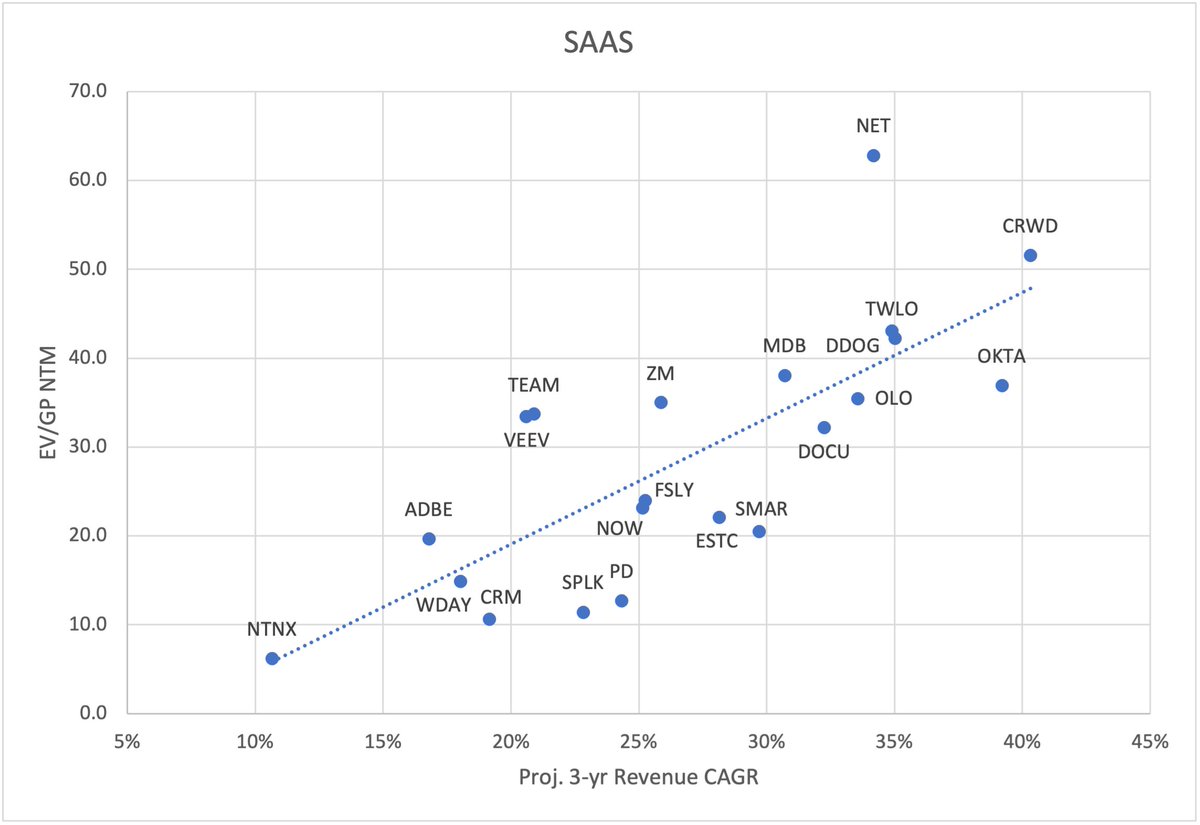
SAAS
$TWLO 43x / 276x
$DOCU 32x / 123x
$SPLK 11x
$WDAY 15x / 43x
$NET 63x
$FSLY 24x
$PD 13x
$ADBE 20x
$ZM 35x
$TEAM 34x
$SNOW 95x
$CRM 11x
$VEEV 33x
$CRWD 52x
$DDOG 42x
$OLO 35x
$NOW 23x
$OKTA 37x
$SMAR 20x
$MDB 38x
$NTNX 6x
$ESTC 22x
$TWLO 43x / 276x
$DOCU 32x / 123x
$SPLK 11x
$WDAY 15x / 43x
$NET 63x
$FSLY 24x
$PD 13x
$ADBE 20x
$ZM 35x
$TEAM 34x
$SNOW 95x
$CRM 11x
$VEEV 33x
$CRWD 52x
$DDOG 42x
$OLO 35x
$NOW 23x
$OKTA 37x
$SMAR 20x
$MDB 38x
$NTNX 6x
$ESTC 22x
Real Estate / Healthcare / Gig Economy / Gaming / Other
$FVRR 29x / 226x
$UPWK 17x / 254x
$Z 10x / 45x
$ABNB 18x / 105x
$RDFN 13x / 115x
$PTON 17x / 136x
$TDOC 17x / 80x
$GDRX 15x / 44x
$LTCH 93x
$BZUN 3.3x / 15x
$EGLX 20x
$SKLZ 14x
$AMD 16x / 31x
$FVRR 29x / 226x
$UPWK 17x / 254x
$Z 10x / 45x
$ABNB 18x / 105x
$RDFN 13x / 115x
$PTON 17x / 136x
$TDOC 17x / 80x
$GDRX 15x / 44x
$LTCH 93x
$BZUN 3.3x / 15x
$EGLX 20x
$SKLZ 14x
$AMD 16x / 31x

Can't wait for Q2 earnings 🔥. Good luck!
What stands out the most to you?
What stands out the most to you?
• • •
Missing some Tweet in this thread? You can try to
force a refresh