Lion Profile picture
Engineer, father, and investor. Sharing my investment journey and thoughts. Constantly learning and curious. Only opinions here.
5 subscribers
Sep 4, 2022 21 tweets 7 min read
This Q2 2022 earnings season is coming to an end so it is a good time to assess where valuations stand and how analyst have changed their expected growth for each company.

First, let’s compare P/FCF LTM vs 3-yr Revenue Growth for all companies: 
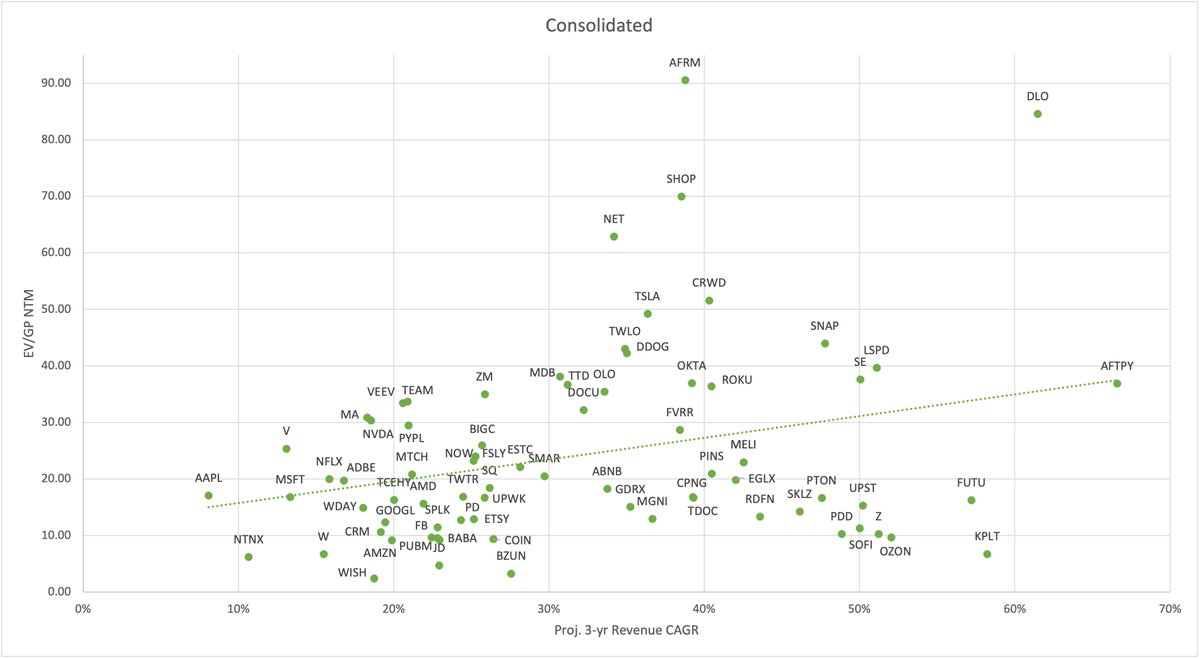
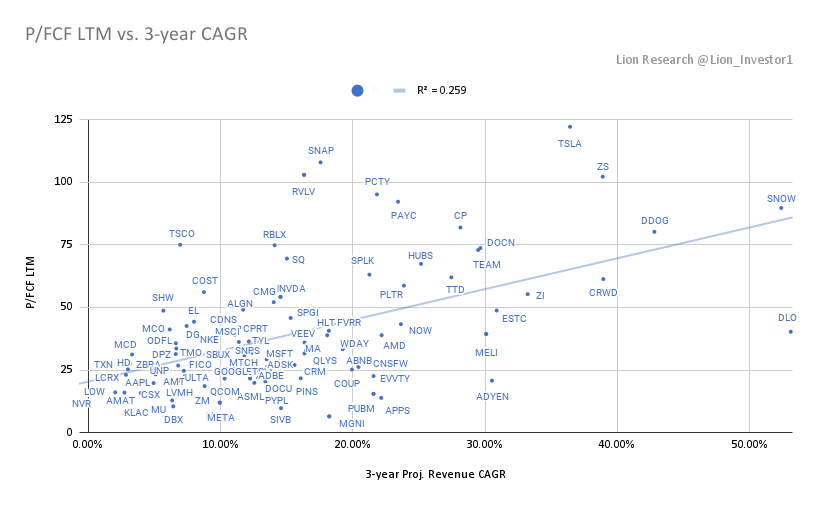
Next, we see the comparison based on a P/E NTM basis vs 3-yr Revenue Growth for all companies.

Comparing valuation multiples from different industries should not be used as an investment decision driver, but it is an interesting exercise to have an overall current view:
May 7, 2022 8 tweets 2 min read
Investing Holy Grail:
Earnings growth x multiple expansion x share buybacks.

$DPZ last 10 years:
1. P/E 20 to 30 (1.5x)
2. Earnings: $105M to $510M (4.9x)
3. Bought back 40% of their shares (1.6x)

Total return: 1.5 x 4.9 x 1.6 = 11.8x
CAGR return: 29%

Other examples? $ODFL

Past 10 years:
1. P/E 19 to 29 (1.53x)
2. $140M to $1034M (7.4x)
3. Bought back 10.4% of shares (1.13x)

Total return: 1.53 x 7.4 x 1.13 = 12.8x
CAGR return: 30%
May 1, 2022 5 tweets 2 min read
Valuations continue to decrease for high quality companies with high ROIC, that have delivered high CAGR returns over the years.

This is the comparison of the current NTM P/E versus the average 2010-2019 NTM P/E for these companies. Image Below we can see where they were at the time and the evolution over the past month and a half.

At the time, 60% of companies where still over their historical multiples. Today, 47% are still over their historical multiples vs 53% below.

Apr 22, 2022 5 tweets 1 min read
Bears are currently in control in the growth sector.

Fundamentals matter little on the short term when a sector is out of favor, especially after a bubble.

For long term investors, some profitable growth companies are becoming more attractive with a 3+ year investment horizon: These companies are profitable and they are getting closer or reaching lower multiples than more mature and established non-tech companies.

Of course, WS estimates can vary with actual execution over time so an assessment of quality is key before investing. Not all will succeed
Mar 19, 2022 13 tweets 3 min read
Winners keep on winning.

Here we evaluate 40 of the biggest winners in the market in the past decade.

They were able to compound between 14% and 67% CAGR for 5+ years and are currently valued on average at NTM 31x P/E and 40x FCF. These are special companies, that have stood the test of time and delivered high returns to shareholders.

One of the main characteristics that most of these companies have in common is achieving high return on capital:
Mar 14, 2022 11 tweets 3 min read
After Q4 earnings reports and recent volatility, we take a look at different valuation multiples of technology companies.

Many are profitable on a free cash flow basis, so first we compare EV/FCF LTM vs 3-yr Revenue Growth estimates: Based on the business characteristics and financials, sometimes valuations between free cash flow multiples and EBITDA multiples vary widely.

In this chart, we compare EV/EBITDA NTM vs 3 year Revenue Growth estimates:
Jan 29, 2022 13 tweets 5 min read
During the current correction, we have seen multiples contract after the massive expansion we had with Covid and QE. Here is where we stand at the beginning of Q1 2022 earnings season.

First, let’s compare EV/GP NTM vs 3-yr Revenue Growth estimates: 
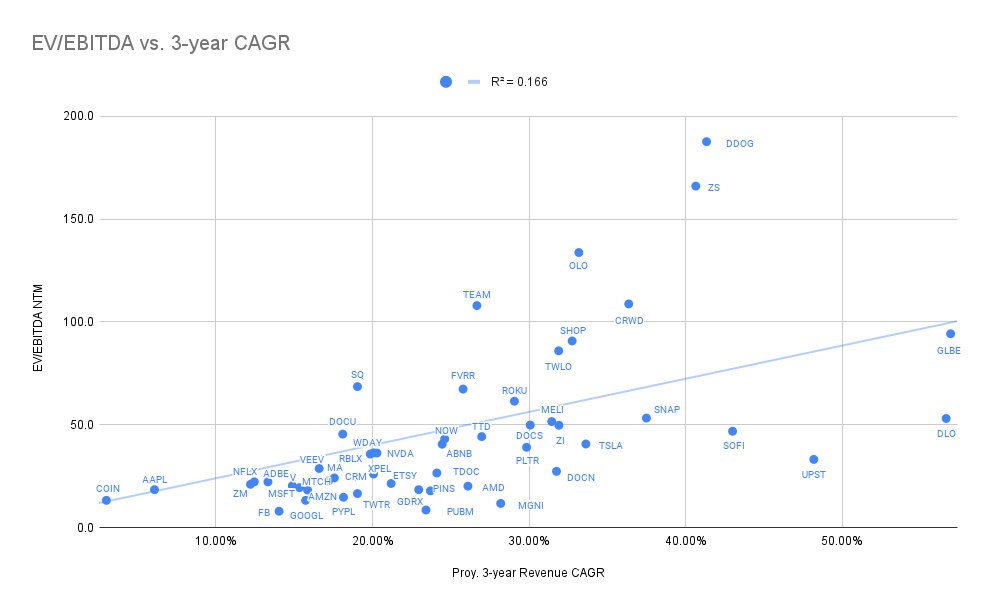
In the current lower liquidity environment, valuation has become more important. Many investors prefer companies that are profitable on an EBITDA and Free Cash Flow basis.

In this chart, we compare EV/EBITDA NTM vs 3 year Revenue Growth estimates:
Dec 4, 2021 12 tweets 4 min read
Here are the updated valuations after the recent volatility and Q3 earnings. I am looking at the following metrics:
1. EV/GP NTM
2. EV/EBITDA NTM
3. EV/FCF LTM

This is the consolidated graph comparing EV/GP NTM vs estimates of 3-yr revenue growth: Of the 82 companies analyzed, 62 have positive NTM EBITDA and 49 are FCF LTM profitable.

Here is the consolidated graph comparing EV/EBITDA NTM vs estimates of 3-yr revenue growth:
Nov 24, 2021 9 tweets 3 min read
We are seeing a continued evolution of multiples contracting in many companies. Some have come back to pre-covid levels (2018-2019) but there are many that still have significantly higher multiples.

Here is a comparison of the changes in multiples we had in Aug 2021 vs Nov 2021 
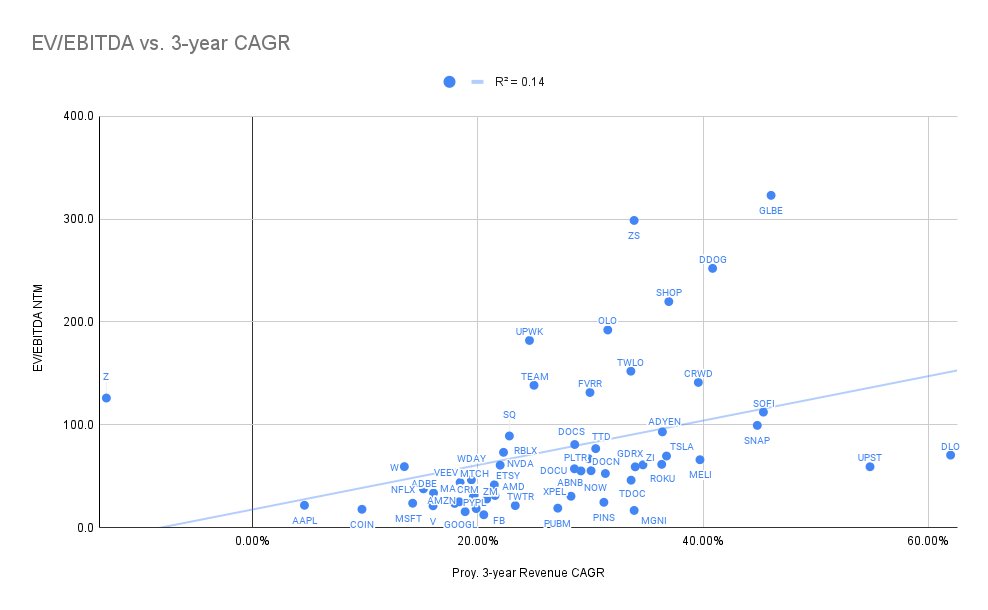
The majority of these companies are seeing multiples contracting. These are some of the most severe in the past 4 months:
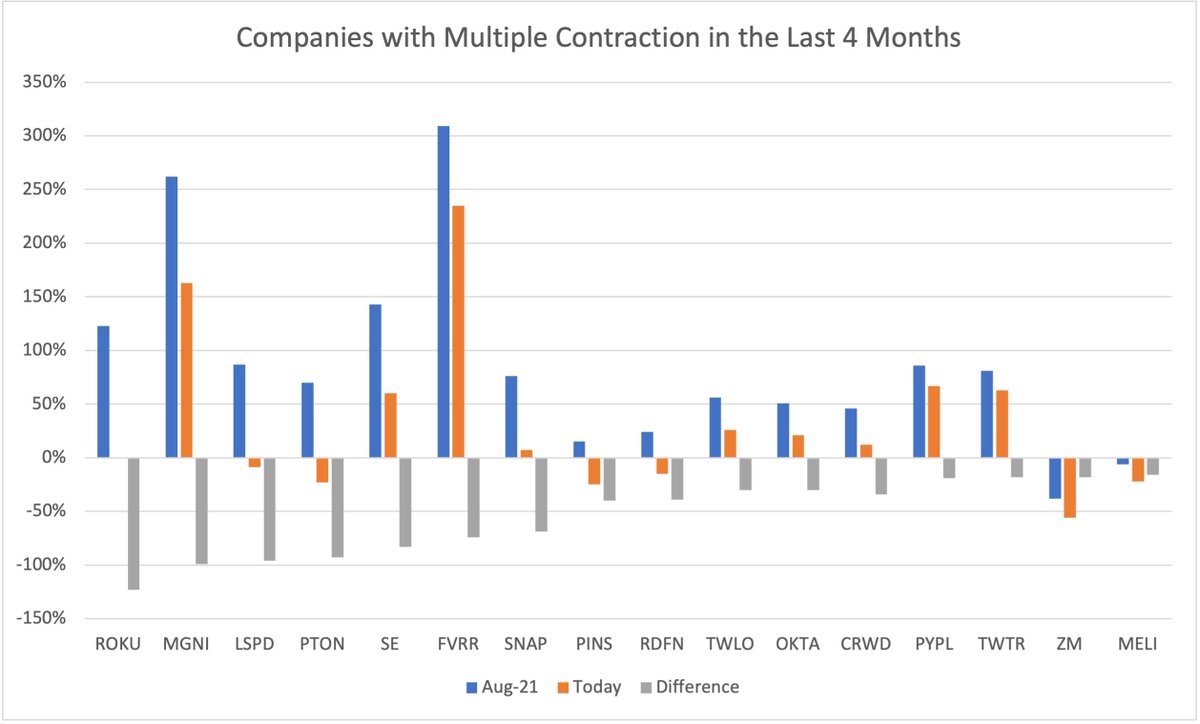
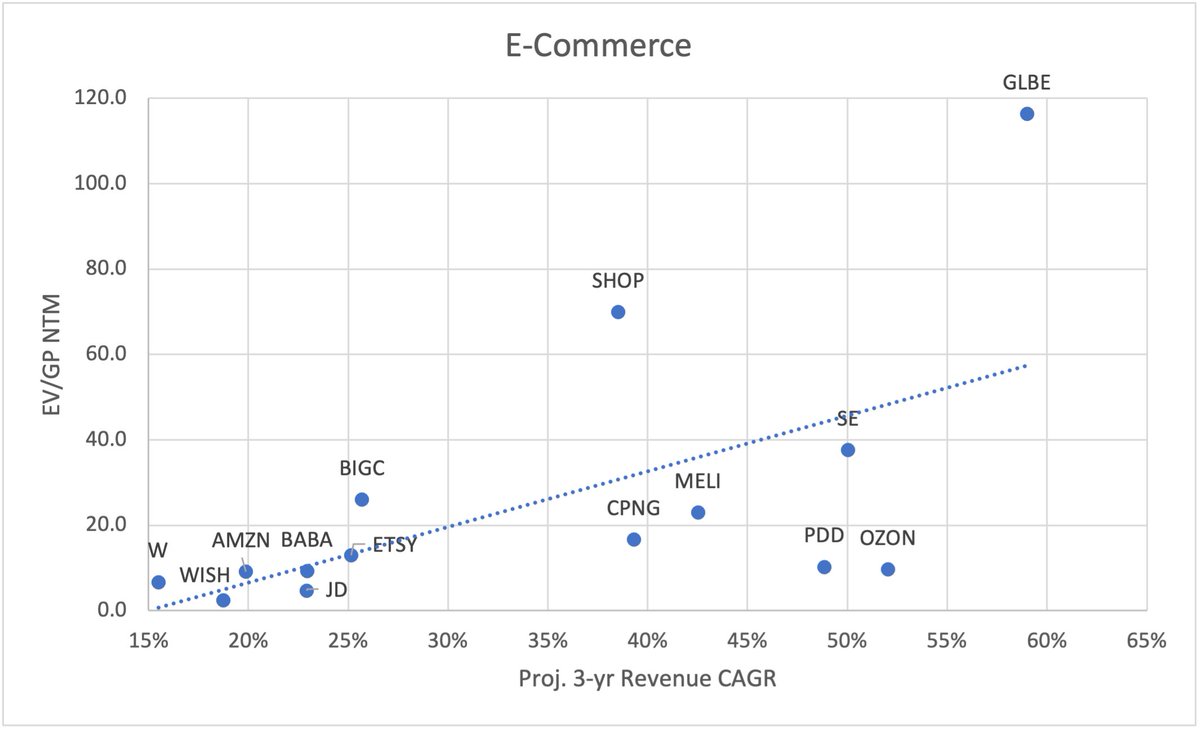
Difference between Aug2021 and Nov 2021:
$ROKU -123%
$MGNI -99%
$LSPD -96%
$PTON -93%
$SE -83%
$FVRR -74%
$SNAP -69%
$PINS -40%
$RDFN -39%
$CRWD -34%
Nov 16, 2021 5 tweets 2 min read
$SE Sea Limited earnings thoughts:

Revenue growth came in strong at $2,688M, which is 121.8% YoY and 17.91% QoQ.

1. E-commerce is executing impressively and grew 25% QoQ (on top of a 30% QoQ growth in Q2).

2. Digital entertainment is showing signs of slowing down.

⬇️ E-Commerce
Orders grew to 1,700 million from 1,400 and 1,100 in Q2 and Q1.
GMV came in at 16.8 billion up from 15 and 12.6 in Q2 and Q1.
Both growth rates in Q3 are slightly slower than Q2 but still very strong and particularly impressive compared to other e-commerce players.
Oct 24, 2021 8 tweets 3 min read
After an interesting and volatile start to the Q3 earnings season, we can see where valuation multiples stand for technology companies.

This is the consolidated graph with all the companies comparing EV/GP NTM vs estimates of 3-yr revenue growth: E-Commerce
EV/GP NTM

$AMZN 8.1x
$BABA 7.9x
$SE 37.5x
$MELI 22.9x
$JD 4.9x
$W 6.0x
$SHOP 61.2x
$CPNG 10.7x
$ETSY 16.5x
$PDD 10.2x
$OZON 7.1x
$BIGC 18x
$GLBE 104x
Oct 22, 2021 9 tweets 2 min read
I sold $PINS this week.

I am aware that I may realize I was wrong over time but after thinking hard about it, I made the decision and I want to be transparent about it.

Here is why I made this decision ⬇️ $PINS did not have a great report last quarter.

Financial numbers where good (growth, margins, ARPU) but I did not like management talking about "web users" and "mobile users" to justify the user slow down.

However, I did see some truth in it, so I decided to hold and wait
Sep 25, 2021 6 tweets 2 min read
Sustainability of growth in SaaS: Will they accelerate or slow down in 2022 vs 2021?

Here is the % difference NTM - LTM and overall NTM growth:

$BILL Difference: +51% / NTM growth: 101%
$AI +16% / 36%
$SPLK +13% / 16%
$PCTY +12% / 25%
$PAYC +6% / 24%
$ADSK +4% / 18% % difference NTM - LTM and overall NTM growth:

$CRM +2% / 23%
$DOCN +2% / 31%
$WDAY +2% / 19%
$ZEN +1% / 27%
$ZUO +1 / 12%
$WKME 0% / 29%
$QLYS 0% / 12%
$BL 0% / 20%
$OKTA -1% / 44%
$APPN -2% / 16%
$BIGC -3% / 36%
$FROG -3% / 34%
$SPT -3% / 31%
$PD -4% / 25%
$PLAN -4% / 25%
Aug 28, 2021 10 tweets 7 min read
Now that most companies have reported earnings, it is a good time to assess where current valuation multiples stand and the estimates of revenue CAGR for the next few years.

This is the consolidated graph with all the companies: In this other one, I included some companies that I had to exclude in the first graph:
$AFRM
$SNOW
$DLO
$GLBE

The next graphs are grouped by industry.
Aug 26, 2021 6 tweets 13 min read
What is the most underfollowed fintwit account that is sharing quality content on a consistent basis? Many interesting suggestions. Here is the list.
I have arranged it based on follower count:

10k+:
@StockMarketNerd @dhaval_kotecha @skaushi @plantmath1 @aadhansen @realEstateTrent @Crussian17 @hiddensmallcaps @caleb_investTML @lhamtil @SagaPartners @Badpak @qcapital2020
Aug 5, 2021 18 tweets 8 min read
This earnings season the market is adjusting post covid. Seems like we are back to a stock pickers market. One of the important variables to look for is multiple expansion.

The following graph is a comparison of this metric for some companies pre and post pandemic. To calculate the multiple expansion of each company, I compared the average multiple of every quarter from 2018-2019 vs today, using the following metrics:
- EV/GP
- EV/EBITDA
- EV/FCF

This has some limitations as multiples in 2018-2019 may be considered high or low.
Jul 27, 2021 9 tweets 2 min read
Really liked this article "A Dozen Things I’ve Learned from Don Valentine about Venture Capital and Business" from @trengriffin.

Many interesting quotes and knowledge from the founder of Sequoia Capital.

Here are some of the highlights for me 👇 Don Valentine is known as "the grandfather of Silicon Valley Venture Capital".

He was one of the original investors in Apple, Atari, LSI Logic, Cisco Systems, Oracle, and Electronic Arts back in the 1970s. So he has a top notch track record.

Here are some of his quotes:
Jul 24, 2021 10 tweets 5 min read
I like to compare companies with different metrics. It helps me understand a little better each business. This time, I am sharing the metric Gross Profit / Employee.

Hope you find it interesting 🙂

This is the consolidated graph. The next graphs are grouped by industry 👇 1.E-Commerce

Gross Profit / Employee (FY 2020)

$ETSY $909k
$PDD $712K
$W $248k
$SHOP $234k
$BABA $179k
$GLBE $154K
$CPNG $148k
$BIGC $132k
$MELI $125k
$AMZN $120k
$OZON $100K
$JD $55K
$SE $54K
Jul 15, 2021 8 tweets 3 min read
After a few volatile days, it is a good time to assess where current valuation multiples stand and the estimates of revenue CAGR for the next few years.

This is the consolidated graph with all the companies. The next graphs are grouped by industry. E-Commerce

EV/GP NTM and EV/EBITDA NTM (for profitable Cos)

$AMZN 9.1x / 23.6x
$BABA 9.2x / 17.5
$SE 37.6x / 152x
$MELI 23x / 202x
$JD 4.7x / 34x
$W 6.7x / 34x
$SHOP 70x / 499x
$CPNG 17x
$ETSY 13x / 33x
$PDD 10x
$OZON 9.6x
$BIGC 26x
$WISH 2.4x
$GLBE 116x
Jun 28, 2021 18 tweets 10 min read
The past 6 months I have been working to determine my personal (and biased) quality score for most of the companies on my checklist and others I see on fintwit.

Valuation was not a part of this score. Also, this list is not meant to be a stock recommendation. In order to assign a quality score, I used standard parameters to score aspects such as:
- Management
- Culture
- Financial Resilience
- Moat
- Competitive landscape
- Potential
- Past performance
- Share dilution
- Risks
Jun 25, 2021 5 tweets 1 min read
Struggling with the decision to add between $BABA $AMZN or $JD 🤔 $AMZN
✅ E-commerce tailwinds
✅ AWS Cloud
✅ Ads business
✅ Solid moat with logistics
🔢 Good valuation
⛔ Size/Market Cap
⛔ Jeff Bezos out
⛔ Google and Microsoft Cloud