
1)#ZomatoIPO : LONG THREAD: Once in a decade opportunity…. for some?
Is the IPO the golden opportunity for investors, as claimed by many? How much appreciation can one expect? A multi-year holding story or just a listing pop. This time it’s different, or is it? Let’s evaluate:
Is the IPO the golden opportunity for investors, as claimed by many? How much appreciation can one expect? A multi-year holding story or just a listing pop. This time it’s different, or is it? Let’s evaluate:
The authorized share capital of the Company is divided into 880 crore Equity Shares of face value Rs 1 each, paid-up share capital of the Company is Rs 666 crore.
IPO size: Rs 9,350 crore or $ 1.3 BN USD
Valuation of Zomato : Rs 66,000 crore or $ 8.8 BN USD
Ownership as below
IPO size: Rs 9,350 crore or $ 1.3 BN USD
Valuation of Zomato : Rs 66,000 crore or $ 8.8 BN USD
Ownership as below

Start with the balance sheet: We see B/S size increased almost 3 times in FY 21 vs FY 20. The equity infusion of Rs 7,643 cr in FY 21 just before IPO is not co-incidental? While this is not unusual for growth companies, this quantum change has an implications for shareholders.

The below net worth can provide some answers. We see that Zomato acquired entire Indian assets/operations of UBER Eats for Rs 2485 crores is $ 330 Mn appx. This happened in Jan 2020, right before the pandemic. This valuation is important as it offers clues to fair valuation.

So, what does the Uber Eats biz mean for Zomato? Well, its net worth increases 3-fold. That’s the change in balance sheet size we see above. What does this investment buy for Uber? A 9.1% stake in Zomato. That puts valuation of $ 3.5 BN on Zomato in Jan 2020 (before pandemic)
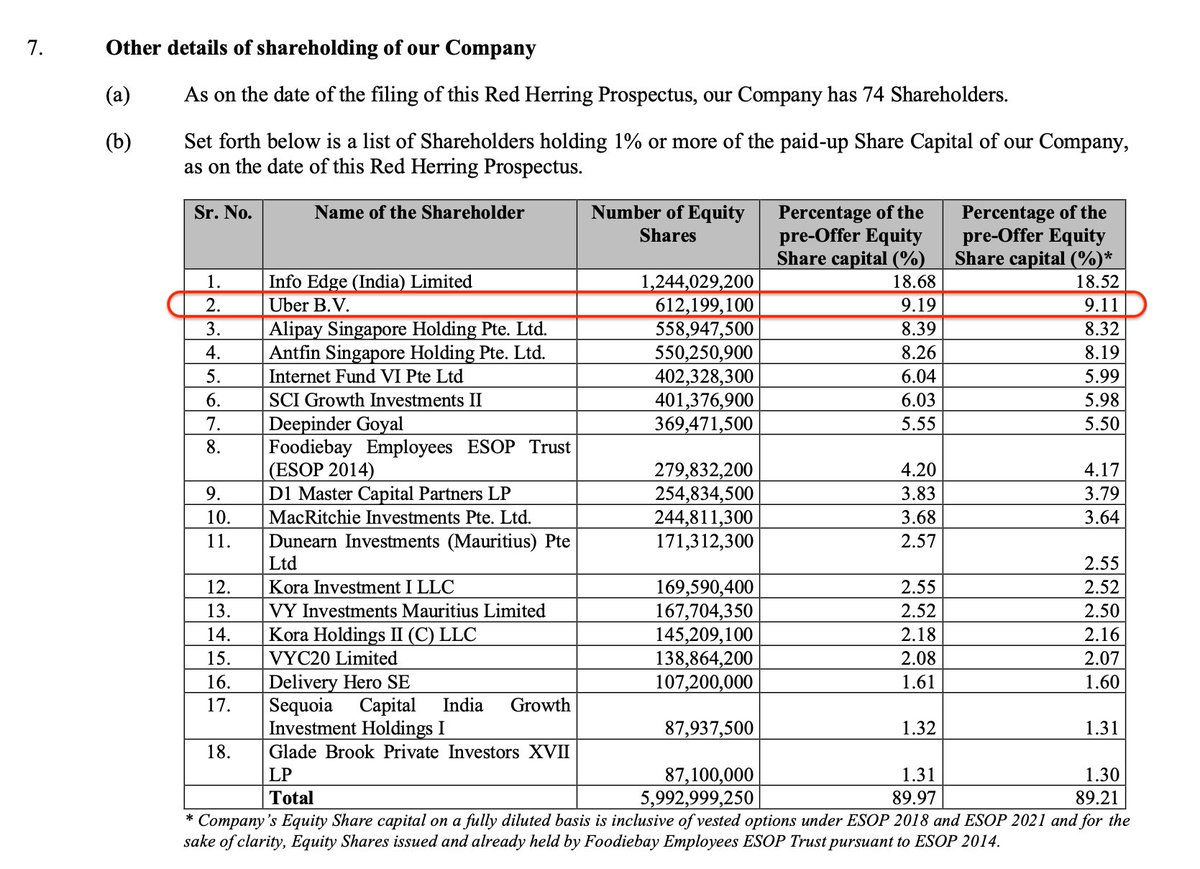
Uber sold the business in Jan 2020 when the world was still “normal”. That valuation should give a fair view of what a business is worth, just an year ago. So why did Uber Eats sell when the business was projected as so lucrative ? CNBC USA has this to say on valuation:

Hmmm, so valuation in Jan 2020 was abt $ 3.0 to $ 3.5 BN. That’s the rate at which Alibaba & Uber bought the stake, just before the pandemic. That grows to $ 8.5 BN in just 18 months ?.Did the market potential change so fast ? What changed ?
I’m intrigued to explore more about the valuation growth. Lets dig into that via the snapshot below. We see that valuation moved from $ 3 BN in 2020 (validatd by Uber Eats stake) moved to $ 3.9 BN in Dec 2020 to $ 5.4 BN in Feb 2021.
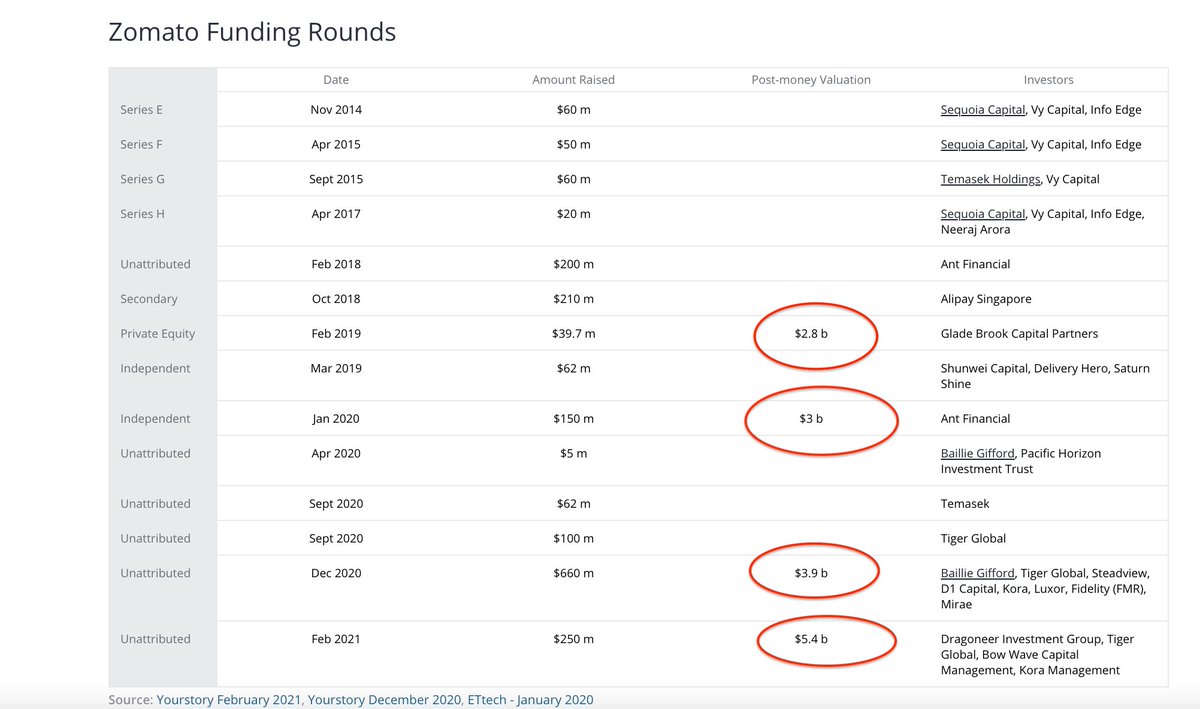
What’s more surprising is that the SAME investors are investing money at $ 3.9 BN & then at $ 5.4 BN ie 40% higher in just a span of 2 mths !! Well, if the owners have to sell something 3 times the price in 18 mths, they have to send “signals” that the venture is worth that much
I’m a bit more curious than to leave it here. May be the sales growth justifies this valuation. Start with the P&L statement. Now I find 2 things interesting (a) Sales numbers are down substantially from FY20 & (b)“Other expenses” are significantly less in FY 21. What’s the story

Zomato calls out drivers of sales & cost for below. What’s not easy to locate is sales from each segment. Majority revenue is for food delivery business. That depends on active users, frequency & order size, net of discount/promotions which are hidden in “other expenses” above

So why did the revenues drop in FY2021 ? Company says - covid lockdown impacted business. Surprising, since online giants grew faster in pandemic. And why should the average order size drop? More importantly, why did new restaurants enrollment didn’t increase much from 143 K odd?
Shouldn’t lockdown have increased enrollment of new restaurants, just like PayTM increased count of merchants accepting digital payments ? Possible that Zomato has hit the plateau on the restaurant enrollment. Avg order value also fell from Rs 400 odd to Rs 238. Sign of worry!

On monthly active users of 42 Mn, do you know that only 52% are from India & rest come from outside? No profitability details are provided for that analysis. We don’t know if global expansion is providing user base growth until IPO without any profitability. Try analysing that.
If this was not enough, there is another devil in details. Company changed its revenue recognition method midway. Earlier, Zomato counted delivery charges as revenue & netted off the discounts. Since Oct 2019, it converted to a “pure tech platform provider”, whatever that means

So Revenue now is the platform & facility fee provided to “delivery partners & restaurants”, & all promotions are included in advt/sales promotions expenses. Now how do you compare FY21 & 20 sales ? Isn’t it prudent to disclose revenues in both old & new methods of accounting?
This acountng change is also the reason why the “other expenses” have increased in FY 2019 to Rs 4000 crore & then dropped to Rs 1500 off crore in FY 21 in a listing year. That saves Rs 2500 crore which could have been a loss in promotions. How does that impact earnings ? Here:

Add this Rs 2500 crores to FY21 & the losses will be MORE THAN those in 2020. Vola….reduce sales promotion expenses in listing year & show a much lower loss. Agreed that sales is also lower but as discussed, revenue recognition changed midway so what sales do we compare with?
And what is this EPS calculation above ? When profits go up, EPS improves. Here we have losses. But the share base is also 25% up from FY 2020. So EPS (Loss) per share looks smaller than it actually is. As you can see, it is meaningless to compare EPS loss on increased share base
So how do we compare historical performance? There are some proxies that we can explore in absence of clear sales indicators & biz details. Look at employee costs. FY21 has 15% lower costs vs FY20. For a company harping on growth & such valuation, this drop doesn’t match up

I understand how some of you will say. It’s a new age company & I’m talking old school stuff. Yes, but at what price? Are there any price comparisons I can make to value Zomato ? I tried to look thru the document. It says “comparisons with other listed industry peers on page 122”
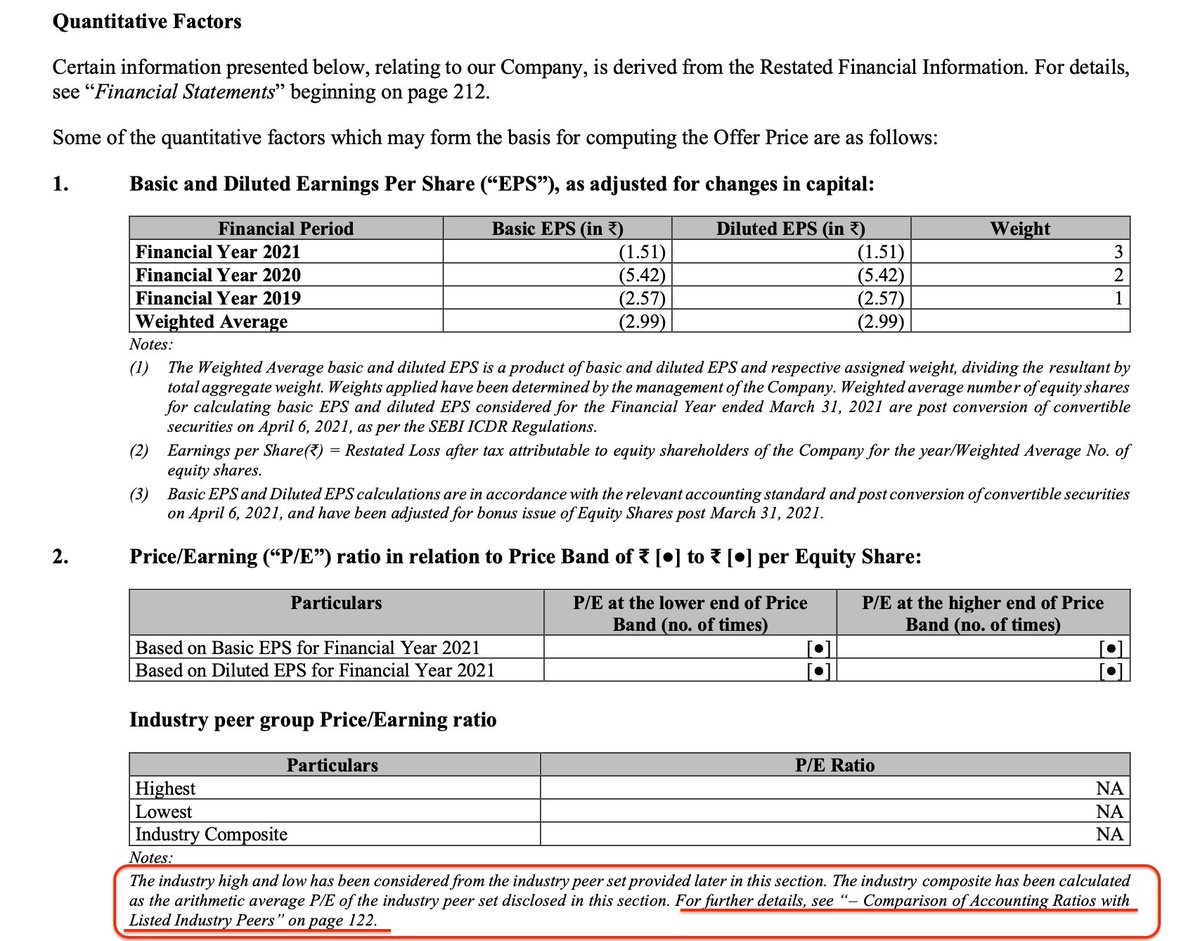
Curiously enough, I turn to page 122 & find this. Seriously ? You took this path to “disclose” there are no listed peers? Or may be that it was an after thought to not compare any listed peers as people would figure out the overpriced offer ? Well, let me save you the trouble

Curiously enough, I turn to page 122 & find this. Seriously ? You took this path to “disclose” there are no listed peers? Or may be that it was an after thought to not compare any listed peers as people would figure out the overpriced offer ? Well, let me save you the trouble
DoorDash got listed in US in Dec 2020 & valuations couldn’t have been any better. Here is what it is worth:
•IPO date: Dec 2020 (good timing again)
•Listing price: $ 190 & $ 62 BN mkt cap
•Current price: $ 178 & $ 58 BN mkt cap.
•Revenues: $ 2.8 BN
•IPO date: Dec 2020 (good timing again)
•Listing price: $ 190 & $ 62 BN mkt cap
•Current price: $ 178 & $ 58 BN mkt cap.
•Revenues: $ 2.8 BN
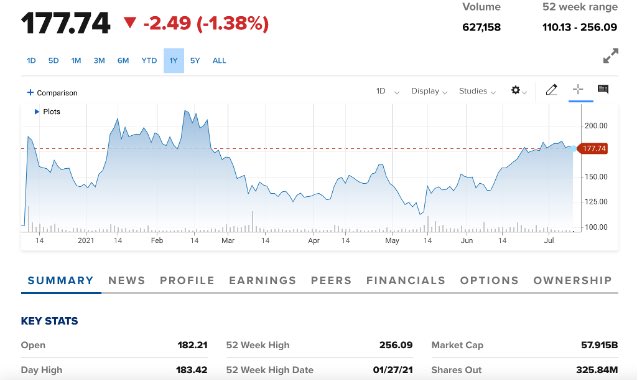
Here is how obscene the comparison looks. Sales drop but still hide much due to substantial accounting change. Order size fell & restaurant count has stagnated. DoorDash avg order size is $ 33 vs Zomato is just $4 per order. Assume 15% net margin, you buy Zomato at PE of 15,723

However, despite all this, Zomato’s valuation grows from $ 3 BN to 8.6 BN in 18 mths. Now that’s an innovation at Zomato that I’m not willing to pay for. I’m sure they’ll find many who would like to own “fools gold”. I’ll pass.
• • •
Missing some Tweet in this thread? You can try to
force a refresh


