A thread about STBT options selling,
The purpose is simple to capture overnight theta decay,
Generally, ppl sell ATM straddle with hedge or sell naked options,
But I am using Today’s price action for selling options in STBT,
(1/n)
The purpose is simple to capture overnight theta decay,
Generally, ppl sell ATM straddle with hedge or sell naked options,
But I am using Today’s price action for selling options in STBT,
(1/n)
Its work on both index (Nifty, BNF) as well some standard stock but i used only for Index on every day and Last 10 days monthly expiry i do in stocks only specific,
It’s purely STBT type’s trade sell today and buy tomorrow kind,
(2/n)
It’s purely STBT type’s trade sell today and buy tomorrow kind,
(2/n)
Let’s start the strategy,
Every day at 3:15 PM, Open Nifty or BNF chart in daily TF.
See the last candle formation only; we take trade always based on the last candle formation
(3/n)
Every day at 3:15 PM, Open Nifty or BNF chart in daily TF.
See the last candle formation only; we take trade always based on the last candle formation
(3/n)

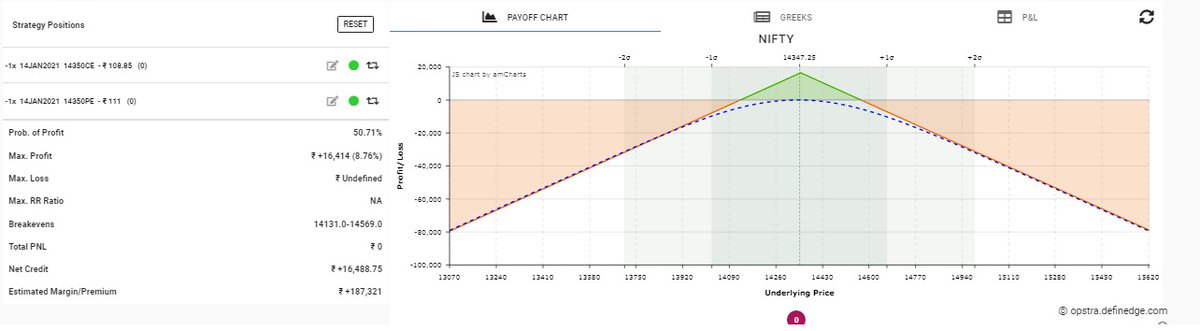
Case 1:
If Red Bearish candle formation, Mark the high and low of that candle
High 35979, Low 35667. (16th July)
Based on this candle we simply sell credit call spared (Sell 36000 CE and Buy 36300CE) you can make the difference between two calls 300 or 400 as per your risk,
If Red Bearish candle formation, Mark the high and low of that candle
High 35979, Low 35667. (16th July)
Based on this candle we simply sell credit call spared (Sell 36000 CE and Buy 36300CE) you can make the difference between two calls 300 or 400 as per your risk,

Case 2:
Bullish strong candle
High 35238 and low 34922 (5th July) (Refer the image)
Based on this candle we sell credit put spread (Sell 34900 Put and buy 34600 put)
Bullish strong candle
High 35238 and low 34922 (5th July) (Refer the image)
Based on this candle we sell credit put spread (Sell 34900 Put and buy 34600 put)

Case 3:
Doji candle
High 35580, Low 35231 (28th June) - Rfere the image
Based on this we sell strangle 200 points away from the high and low (sell 35800 CE and sell 35000 put)
Doji candle
High 35580, Low 35231 (28th June) - Rfere the image
Based on this we sell strangle 200 points away from the high and low (sell 35800 CE and sell 35000 put)

If Doji formation on Wednesday then we will sell the high and low strike of that day because 200 points away in Wednesday are very less premium.
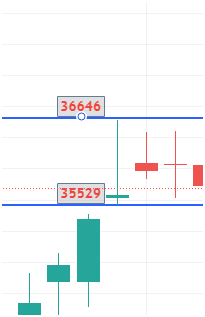
Case 4:
Pin bar candle formation in any side
High 35005 and low 34374 (14th June) - refer image
In this case you can sell naked put(sell 34300 put) or credit put spread (Sell 34300 put and buy 34000 put)
Pin bar candle formation in any side
High 35005 and low 34374 (14th June) - refer image
In this case you can sell naked put(sell 34300 put) or credit put spread (Sell 34300 put and buy 34000 put)

High 36646 low 35529 (5th Feb)
In this case you can sell naked 36600 CE or credit call spread (sell 36600CE and buy 36900CE)
In this case you can sell naked 36600 CE or credit call spread (sell 36600CE and buy 36900CE)
It’s worth reading for you
If you like this STBT options selling approach kindly RETWEET for appreciation
Thank you so much,
If you like this STBT options selling approach kindly RETWEET for appreciation
Thank you so much,
• • •
Missing some Tweet in this thread? You can try to
force a refresh