
Process to read Charts of Banknifty for Intraday trading to plan trades & identify direction based on the price auction
A small thread
Retweet to reach maximum traders
@Mitesh_Engr @ITRADE191 @ProdigalTrader @AdityaTodmal @Puretechnicals9 @hjyadav @Singh7575 @Rishikesh_ADX
A small thread
Retweet to reach maximum traders
@Mitesh_Engr @ITRADE191 @ProdigalTrader @AdityaTodmal @Puretechnicals9 @hjyadav @Singh7575 @Rishikesh_ADX
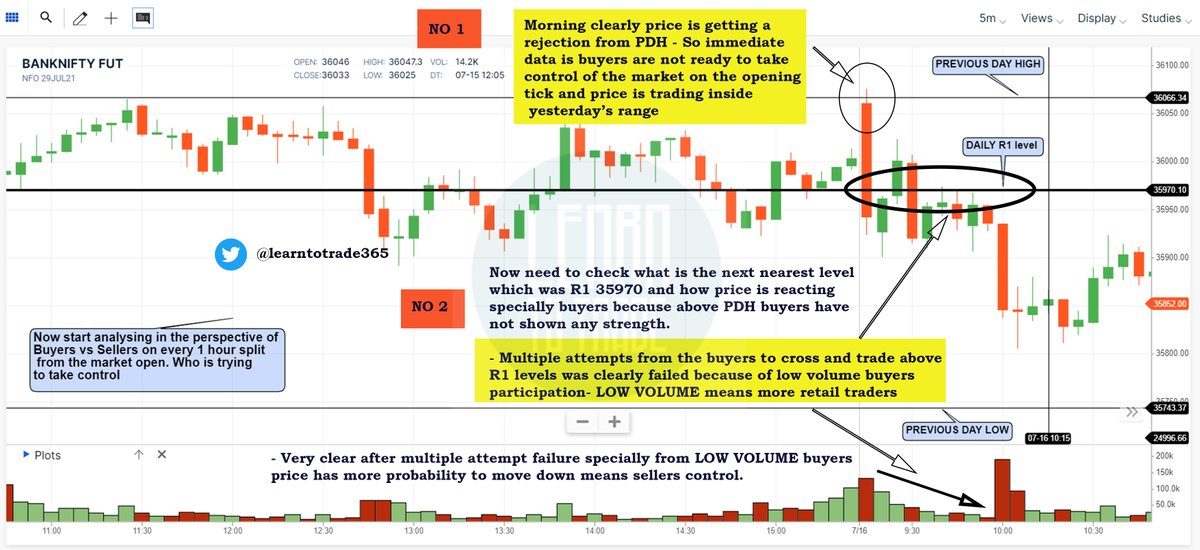
Timeframe used will be 5 minutes and reference level by using simple Previous Day High/Low , Daily pivot points level from daily chart (if any) , Multi day High/Low (if any) 

To understand who is in control buyers or sellers making a split analysis of every 1 hour timespan.

Let's start with first 1 hour Stage 1
Stage 2
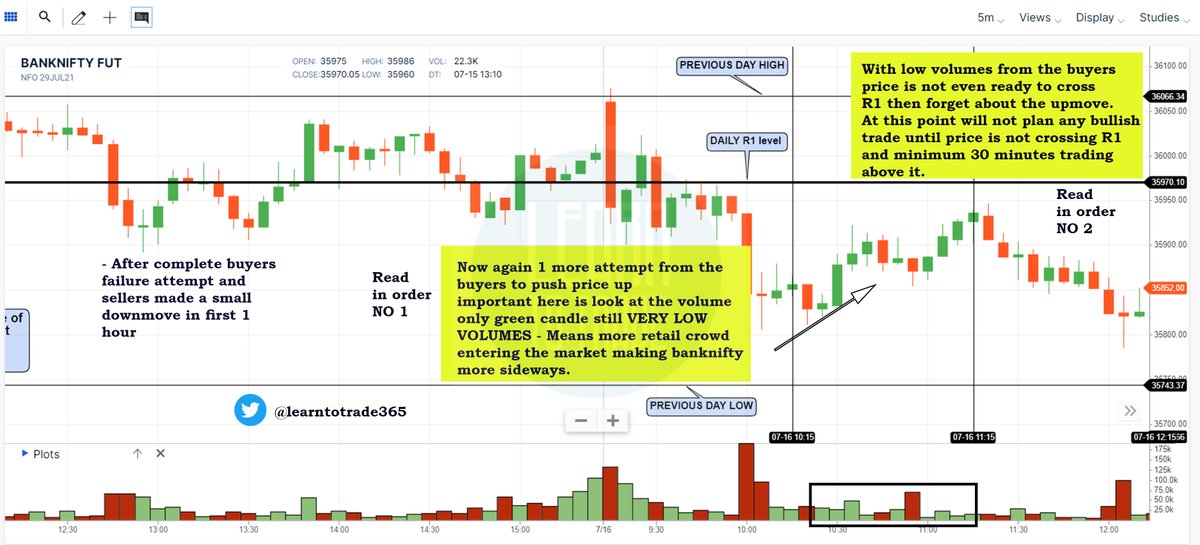
Same need to be done for every 1 hour i have slightly fast forwarded because price not read to cross R1 level.

This is one of the simplest process i use in my trading with the help of few visual reference level like PDH/PDL etc... to understand the direction and read the charts.
Retweet to reach maximum
@jigspatel1988 @kach0289 @ArjunB9591 @tradingmonk_MB @Traderknight007 @KillerTrader_
Retweet to reach maximum
@jigspatel1988 @kach0289 @ArjunB9591 @tradingmonk_MB @Traderknight007 @KillerTrader_
• • •
Missing some Tweet in this thread? You can try to
force a refresh


