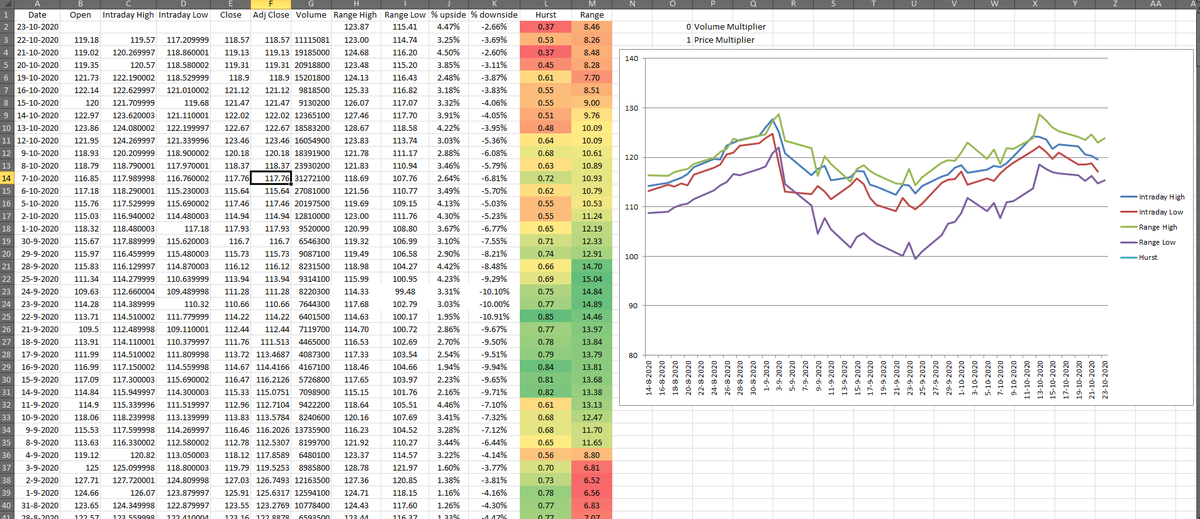
Let's talk about Hurst and how I use it to make sense of this crazy market. We can define Hurst (H from now on) in three regimes.
1. H=0.5 Random price walk, very hard to predict. Do nothing is my go to move. 
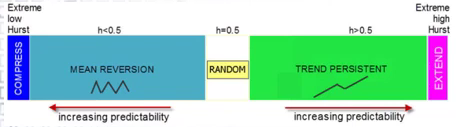
2. H<0.5 Mean reversion is present. Price is more predictable. When H<0.3 there is a change in trend (up or down) going to happen. I make my biggest bets here because I use @42macroDDale research to tell me what is the most likely outcome from a econom and markt reg. perspective.
3. H > 0.5 this is where the extention moves happen. When H is high (>0.8) on multiple time scales we can expect an extention move up or down in price. Personally I find these harder to trade, but if you bought the right stuff at 2. you can sell here.
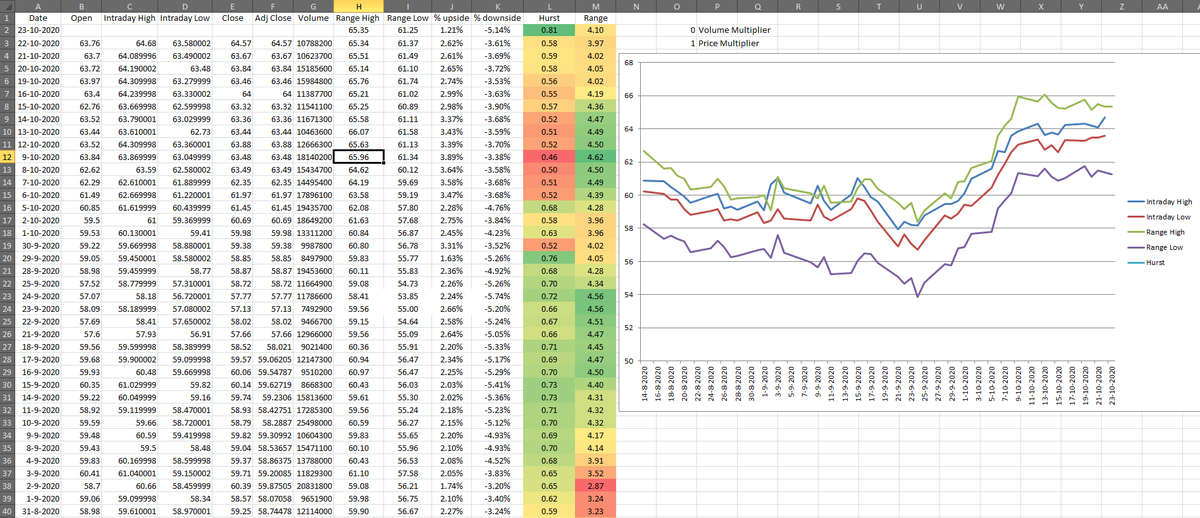
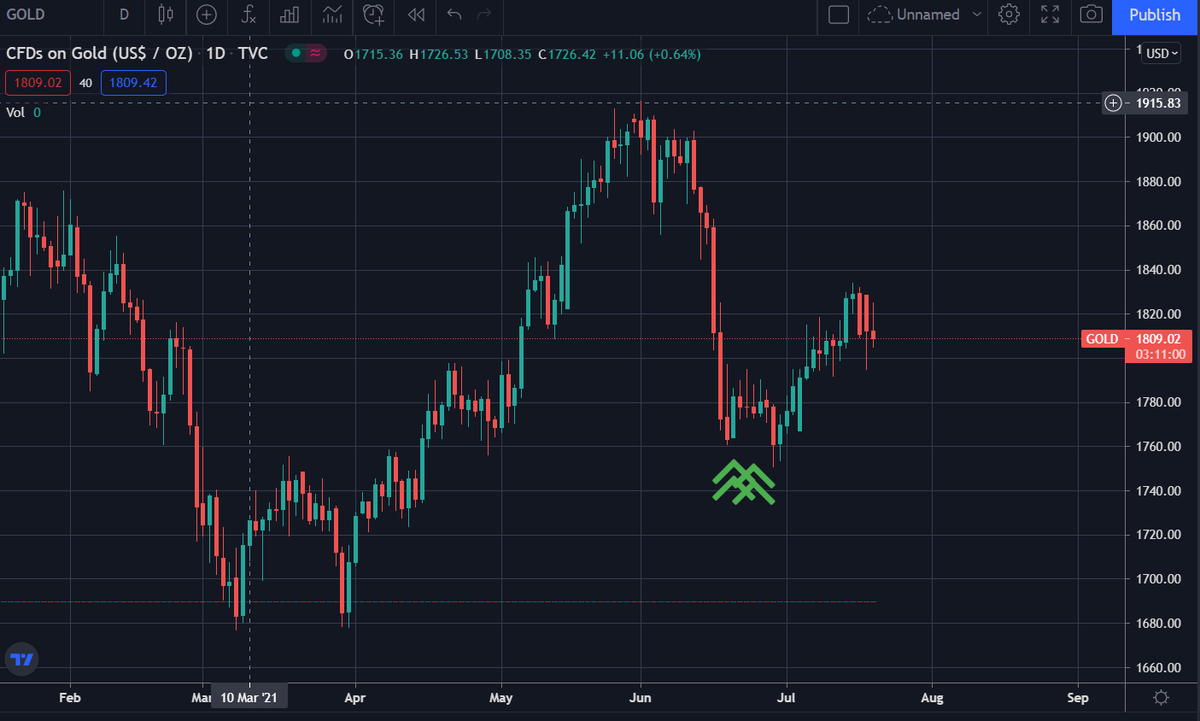
Let's pick a real world example. Gold recently had a mean reversion signal H<0.5, although slim. On June 21 to June 24 it triggered. A change in trend happened here. After that H went back to around 0.7.
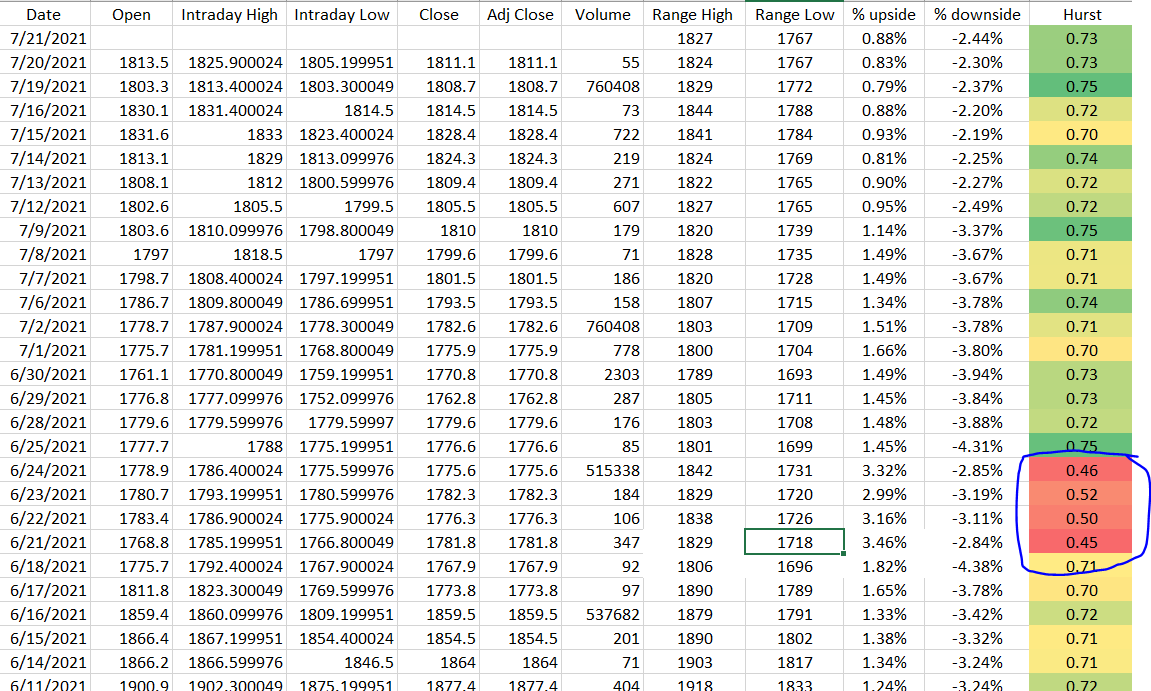
I highlighted the period Gold H<0.5 with green arrows.
Ofcourse this has to be combined with a deflation or inflation economic outlook and that's where DD comes in.
Ofcourse this has to be combined with a deflation or inflation economic outlook and that's where DD comes in.
BTW picture stolen from
Parallax Financial Research, Inc
Have great week,
Tom
Parallax Financial Research, Inc
Have great week,
Tom
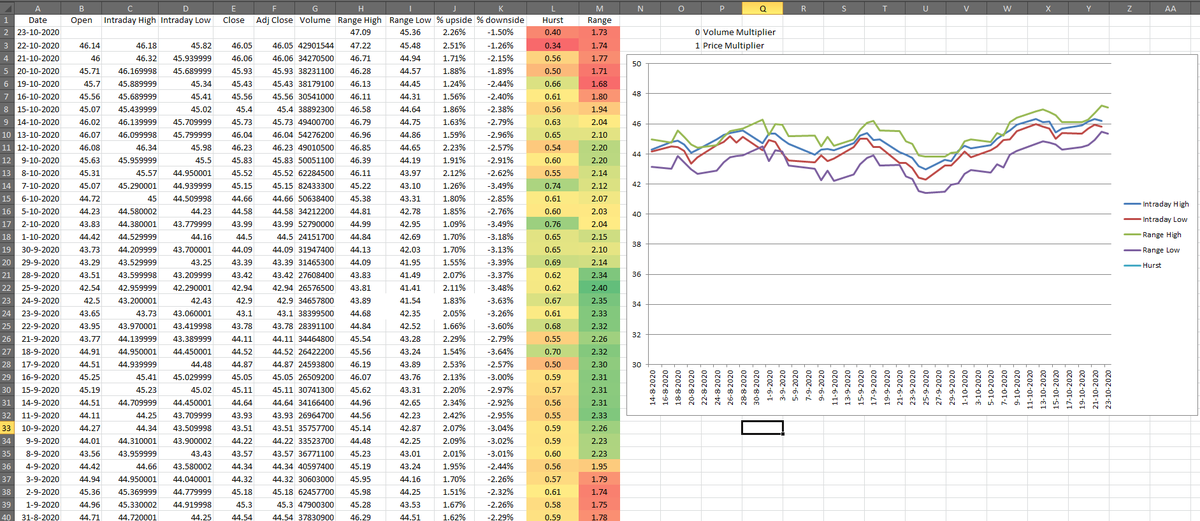
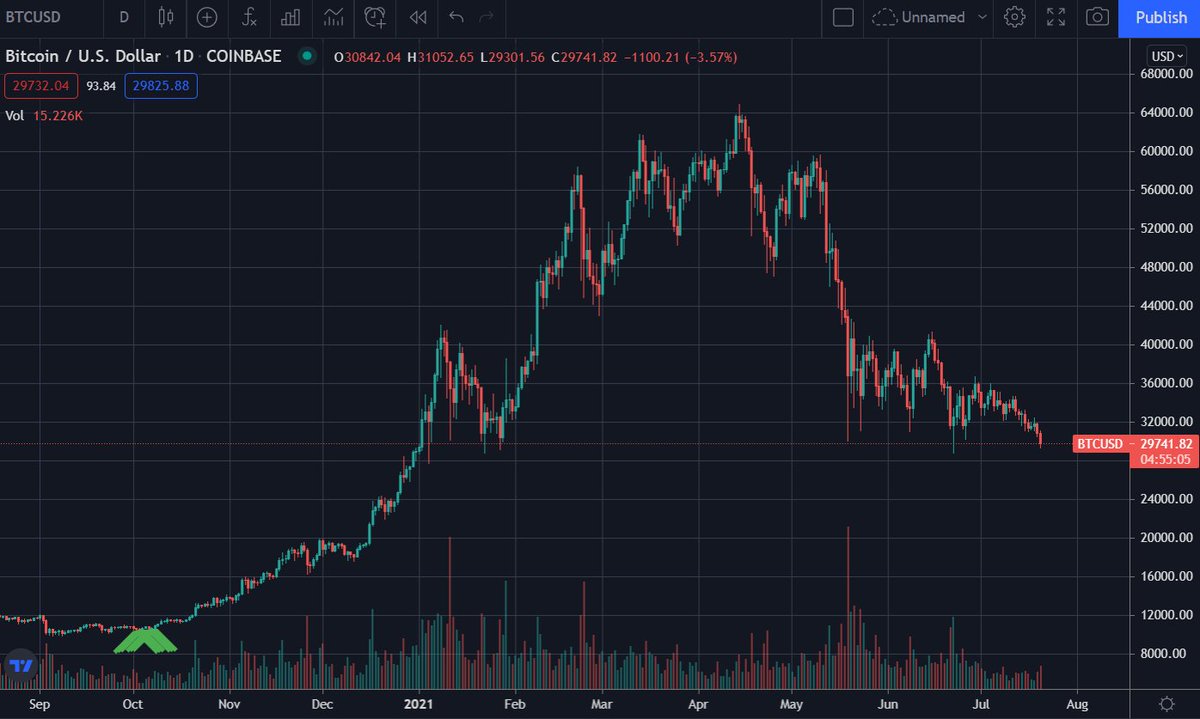
Oh and it works on crypto too :-). I present to you: the biggest trade I never made. Extreme low H around #BTC 10k. Whatever. I'm not mad. No really.
• • •
Missing some Tweet in this thread? You can try to
force a refresh