New! Update!
Job postings on @indeed now 36.5% above pre-pandemic baseline.
Postings rising at slower pace in May/June/July than in March/April.
At this rate, JOLTS job openings would stand at 9.8m as of last Friday.
1/
hiringlab.org/2021/07/21/the…
Job postings on @indeed now 36.5% above pre-pandemic baseline.
Postings rising at slower pace in May/June/July than in March/April.
At this rate, JOLTS job openings would stand at 9.8m as of last Friday.
1/
hiringlab.org/2021/07/21/the…

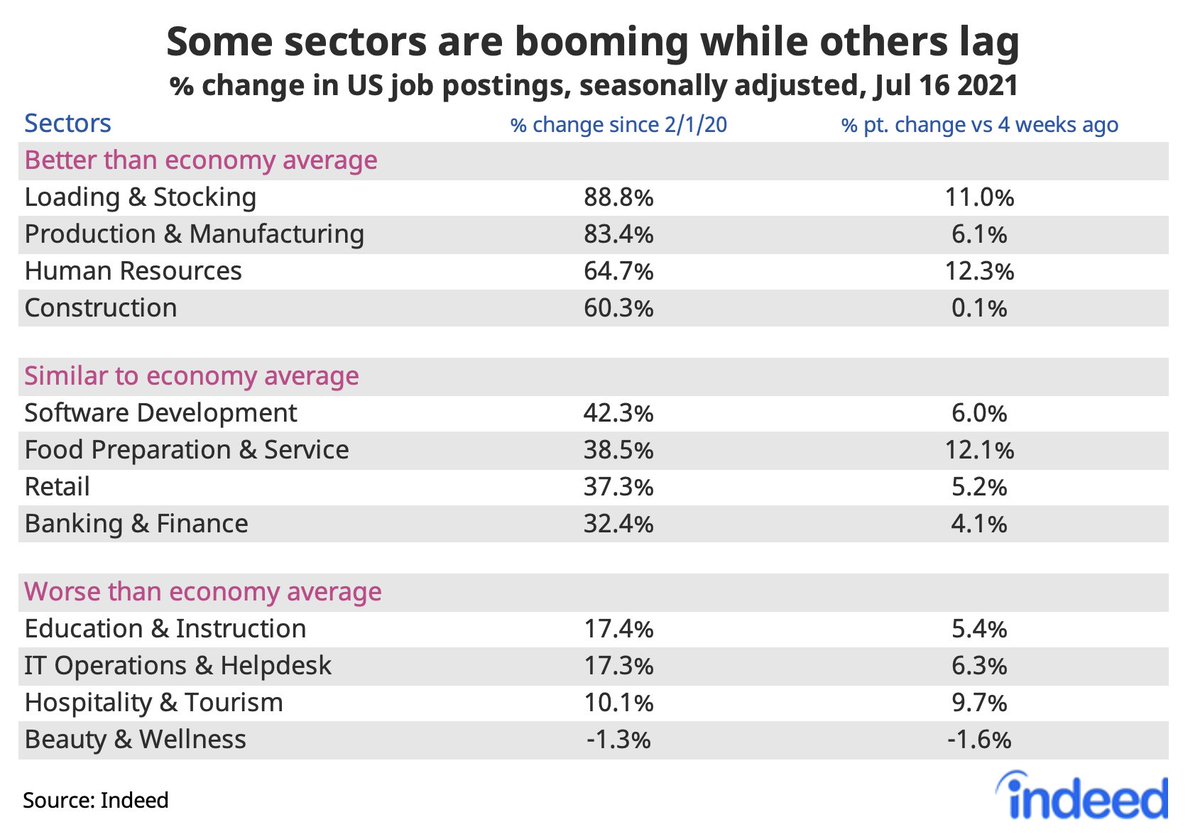
Postings far above baseline in goods sectors: warehouse, manufacturing, and construction.
Plus HR jobs are high and climbing -- employers want to hire the people who will help them hire.
2/
hiringlab.org/2021/07/21/the…
Plus HR jobs are high and climbing -- employers want to hire the people who will help them hire.
2/
hiringlab.org/2021/07/21/the…
It's not just that there are more job postings. Employers are especially eager. More indicate "hiring urgently", as @AE_Konkel found in her research ...
hiringlab.org/2021/07/21/the…
3/
hiringlab.org/2021/07/21/the…
3/

... plus there are more postings touting hiring incentives -- which have been on the rise especially since April.
hiringlab.org/2021/07/21/the…
4/
hiringlab.org/2021/07/21/the…
4/

Postings are up even in lagging metros. San Jose has had the slowest postings recovery, but even there job postings are up more than 10% vs baseline.
hiringlab.org/2021/07/21/the…
5/
hiringlab.org/2021/07/21/the…
5/

Job postings are growing more slowly in high work-from-home metros, where local businesses like retail and restaurants aren't rebounding as quickly.
hiringlab.org/2021/07/21/the…
6/
hiringlab.org/2021/07/21/the…
6/

Job postings up LESS in high vaccination metros. High-vax places tend to be larger and have more jobs in WFH sectors like tech, finance, and other prof services -- places where recovery has been slower since last year.
(one more coming!)
hiringlab.org/2021/07/21/the…
7/
(one more coming!)
hiringlab.org/2021/07/21/the…
7/

Since vaccines became widely available late spring, job postings have increased at similar rate in low, med, and hi vax metros.
Local diffs in pandemic economic effects driven more by local industry mix than by infections, deaths, or vax rates.
8/end
hiringlab.org/2021/07/21/the…
Local diffs in pandemic economic effects driven more by local industry mix than by infections, deaths, or vax rates.
8/end
hiringlab.org/2021/07/21/the…

• • •
Missing some Tweet in this thread? You can try to
force a refresh