The Honest Broker Profile picture
Jul 21, 2021 10 tweets 4 min read Read on X
There is no doubt that attribution claims have run far out ahead of detection of trends

"Since 1951, the number of heavy rainfall days per year for the whole of Germany has hardly changed, almost independently of their definition"
mdpi.com/2073-4441/12/7…

HT @AndrewSiffert
Similarly for Zhengzhou
doi.org/10.1002/joc.51…
I'm not sure how the current strong attribution claims (it's obvious, right?) can be reconciled with the observational data, but I'm sure there is an explanation

If certain extreme events have become much more likely, then evidence should show them being more likely? Or not?
Here is what the US NCA 2017 said about "attribution without detection"

Decreases the chances that you'll miss identifying a climate signal in a rare event, but increases the chances of falsely identifying such a signal

science2017.globalchange.gov/chapter/append…
It turns out -- and science scholars will love this -- the choice of methodology, and thus choice of result, depends upon the message one wishes to convey
"More meaningful questions" take us back to the good ol' IPCC detection and attribution framework
As I have argued often, if conventional IPCC detection & attribution work showed clearly increasing extremes & plausible causes, then the post-modern "event attribution" methods would be unnecessary
forbes.com/sites/rogerpie…
IPCC D&A methods have identified trends & causes in (many regions) for extreme temps & precip with various levels of confidence

But not tropical cyclones, floods, drought, tornadoes

So enter "event attribution" to fill the gap
Why? Explained below via NYT to win a PR battle
I can think of no other area of research where the relaxing of rigor and standards has been encouraged by researchers in order to generate claims more friendly to headlines, political advocacy and even lawsuits . . .

But there you go

/END
PS. There is an absolutely awesome STS dissertation to be written based on this thread. Career prospects might be limited though 😎

• • •

Missing some Tweet in this thread? You can try to force a refresh
 

Keep Current with The Honest Broker

The Honest Broker Profile picture

Stay in touch and get notified when new unrolls are available from this author!

Read all threads

This Thread may be Removed Anytime!

PDF

Twitter may remove this content at anytime! Save it as PDF for later use!

Try unrolling a thread yourself!

how to unroll video
  1. Follow @ThreadReaderApp to mention us!

  2. From a Twitter thread mention us with a keyword "unroll"
@threadreaderapp unroll

Practice here first or read more on our help page!

More from @RogerPielkeJr

Jan 11
🧵
The percentage of a percentage trick is increasingly common & leads to massive confusion

Here a undetectable difference of 0.01 events per year per decade is presented as the difference between a 31% and 66.4% increase (in the *likelihood* of the event, not the event itself) Image
The resulting confusion is perfectly predictable

Here is a reporter (NPR) explaining completely incorrectly:
"The phenomenon has grown up to 66% since the mid-20th century"

False Image
Also, the numbers in the text and figure do not appear to match up
I asked Swain about this over at BlooSkeye Image
Read 4 tweets
Dec 22, 2024
The new hurricane damage time series trick

Step 1: create Frankenstein dataset w/ an increasing trend where there was not an increasing trend before

Step 2: Attribute the increasing trend to climate change

Step 3: Use Frankenstein dataset to impeach other research w/ no trend Image
The reason that the blue and red numbers are different is that they are different measures of hurricane losses

E.g., the red numbers include inland NFIP damage
The blue numbers do not, on purpose, because NFIP only started in 1968

They are apples and oranges
Now 3 peer-reviewed papers (PNAS, JAMC, BAMS) make this most basic of errors by replacing and splicing NOAA BDD to the MWR/NHC time series

Predictably all three papers find an increasing trend in normalized hurricane damage even though landfalling hurricanes are not increasing Image
Read 6 tweets
Dec 21, 2024
A Frankenstein dataset results from splicing together two time series found online

Below is an example for US hurricane damage 1900-2017
Data for 1980-2017 was replaced with a different time series in the green box
Upwards trend results (red ---)

Claim: Due to climate change! Image
The errors here are so obvious and consequential that it is baffling that the community does not quickly correct course

Read about it here
Is my analysis flawed?
osf.io/preprints/osf/…
The IPCC AR6 cited a paper misusing the Frankenstein hurricane loss dataset to suggest that NOAA's gold standard hurricane "best track" dataset may be flawed

JFC - Using flawed economic loss data to suggest that direct measurements of hurricanes are in error! Image
Read 6 tweets
Nov 2, 2024
We’ve reached the point where an IPCC author is openly rejecting the conclusions of the IPCC out of concern over how their political opposition is correctly interpreting the AR6

The integrity of the IPCC on extreme events is now under attack
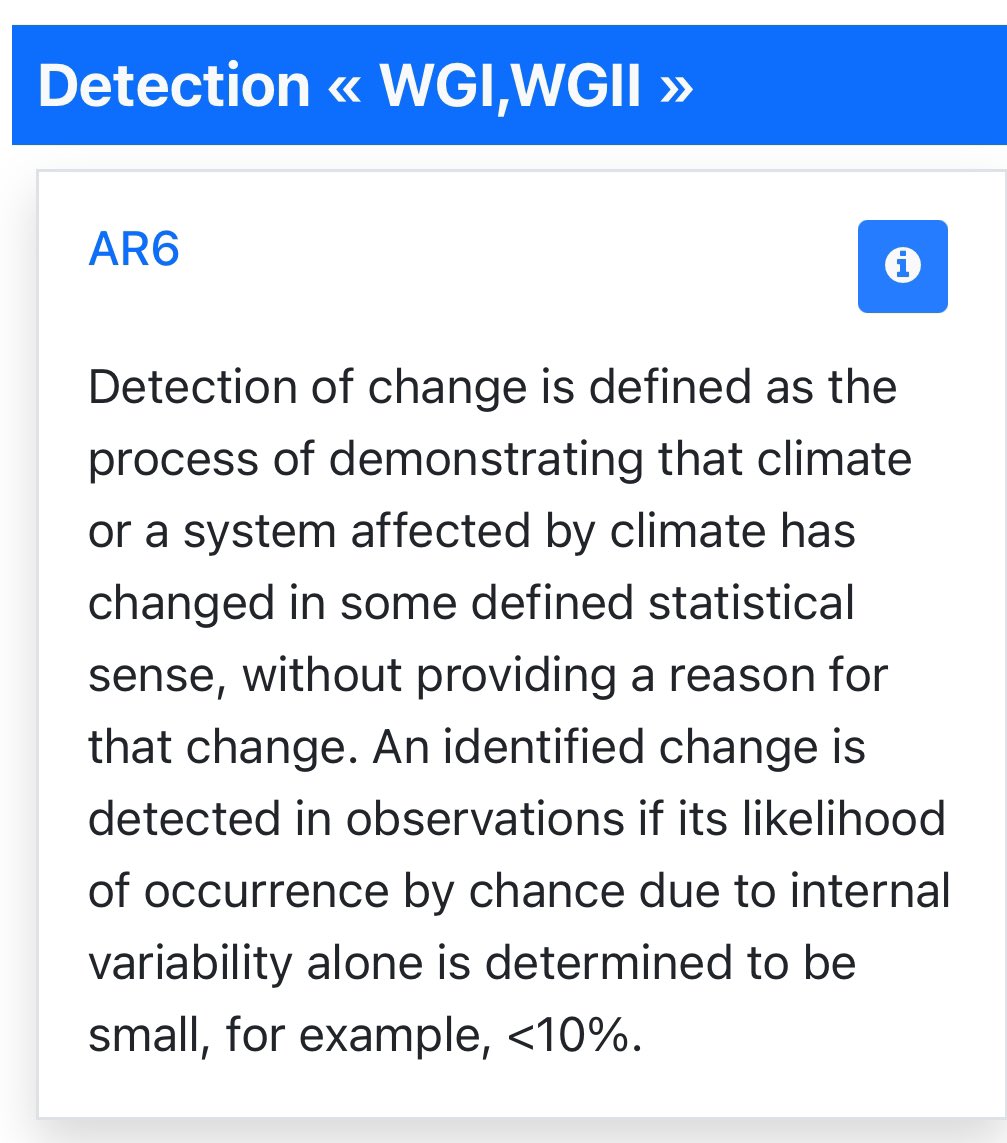
The IPCC explains that a trend in a particular variable is DETECTED if it is outside internal variability and judged with >90% likelihood

For most (not all) metrics of extreme weather detection has not been achieved

That’s not me saying that, but IPCC AR6 Image
The IPCC also assesses that for most (but not all) metrics of extreme weather the signal of a change in climate will not emerge from internal variability with high confidence (ie, >90%) by 2050 or 2100, even assuming the most extreme changes under RCP8.5 Image
Read 6 tweets
Oct 31, 2024
🧵
You won't believe this

The US National Academy of Sciences has a new study committee on Extreme Event Attribution

Among its sponsors are the Bezos Earth Fund and Robert Litterman

Who are they? . . . Image
Image
The Bezos Earth Fund sponsors World Weather Attribution, an advocacy group promoting the connection of weather events w/ fossil fuels in support of press coverage & lawsuits

Robert Litterman is on the board of Climate Central which founded WWA & collaborates on climate advocacy Image
The fact that a NAS committee is funded by political advocates is crazy enough

But that is not all

On the committee itself are individuals from two climate advocacy groups

One . . . the Union of Concerned Scientists which is working to use attribution to support lawsuits . . . Image
Read 7 tweets
Jul 18, 2024
1/3

Climate science is broken

I provided PNAS with irrefutable evidence that a paper it published used a fatally flawed “dataset” compiled by interns for corporate marketing

I asked for a retraction

PNAS investigated & found no problems at all with the dataset

The PNAS reply belowImage
Image
I documented how the “dataset” was created (including contributions of two of my former students)

It was never intended for scientific research, just for selling insurance products

In the next Tweet I’ll link to my post with all of the details

If climate science cannot pass this simple test, it has a serious problemImage
Read 4 tweets

Did Thread Reader help you today?

Support us! We are indie developers!


This site is made by just two indie developers on a laptop doing marketing, support and development! Read more about the story.

Become a Premium Member ($3/month or $30/year) and get exclusive features!

Become Premium

Don't want to be a Premium member but still want to support us?

Make a small donation by buying us coffee ($5) or help with server cost ($10)

Donate via Paypal

Or Donate anonymously using crypto!

Ethereum

0xfe58350B80634f60Fa6Dc149a72b4DFbc17D341E copy

Bitcoin

3ATGMxNzCUFzxpMCHL5sWSt4DVtS8UqXpi copy

Thank you for your support!

Follow Us!

:(