
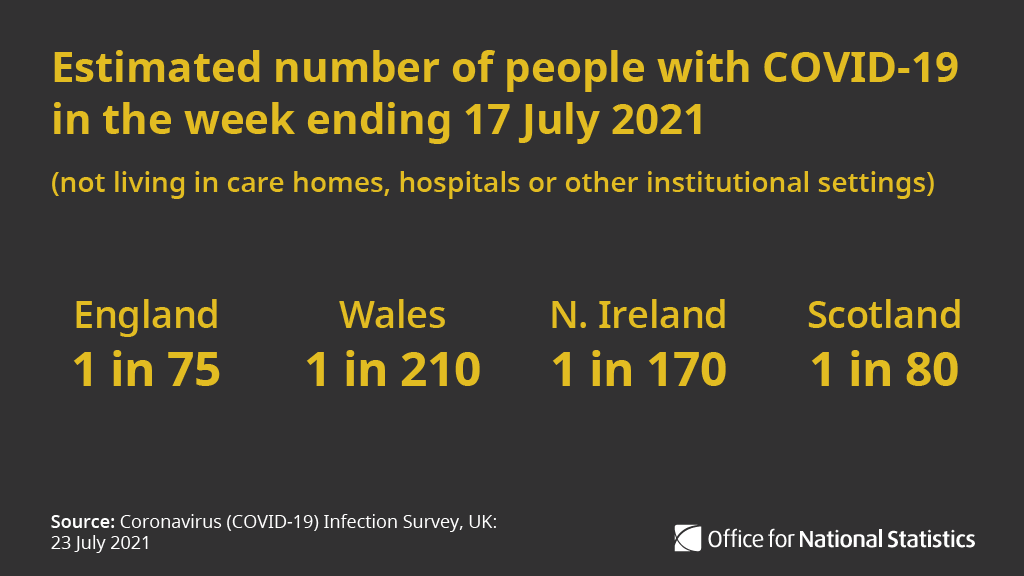
Latest data show #COVID19 rates increased in England, Wales and Northern Ireland in the week to 17 July 2021.
In Scotland the weekly trend was uncertain. Rates in England, Wales and Northern Ireland are similar to February 2021 ow.ly/h8wG50FC9cX
In Scotland the weekly trend was uncertain. Rates in England, Wales and Northern Ireland are similar to February 2021 ow.ly/h8wG50FC9cX
In England, the number of people testing positive for #COVID19 increased across all regions except the North East and North West, where the trend was uncertain ow.ly/OD8U50FC9gO

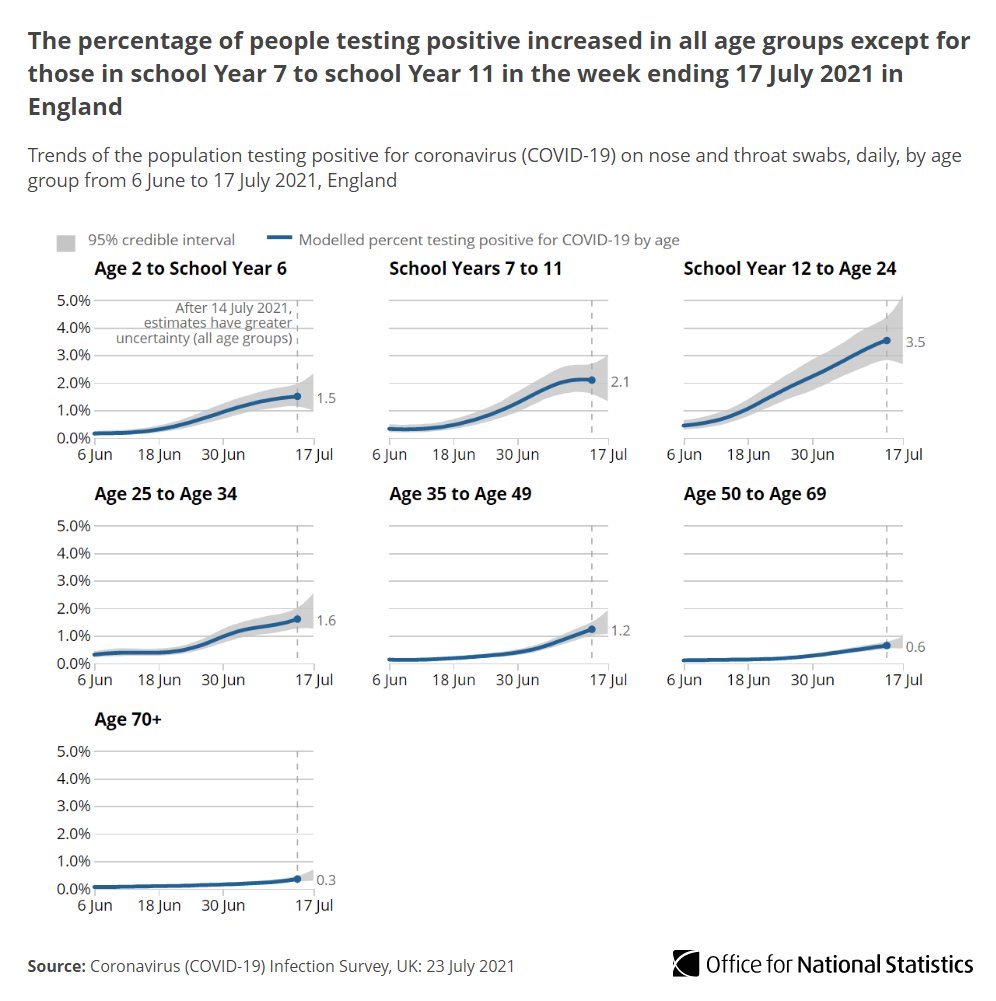
The percentage of people in England testing positive increased in all age groups except school Year 7 to school Year 11 ow.ly/OD8U50FC9gO
Commenting on today’s results Kara Steel, senior statistician for the #COVID19 Infection Survey, said:
Explore our #COVID19 insights interactive tool, combining the latest trends and data concerning COVID-19 from the ONS, Joint Biosecurity Centre and @PHE_uk to show the state of the pandemic across the UK ow.ly/PsjH50FC9PG

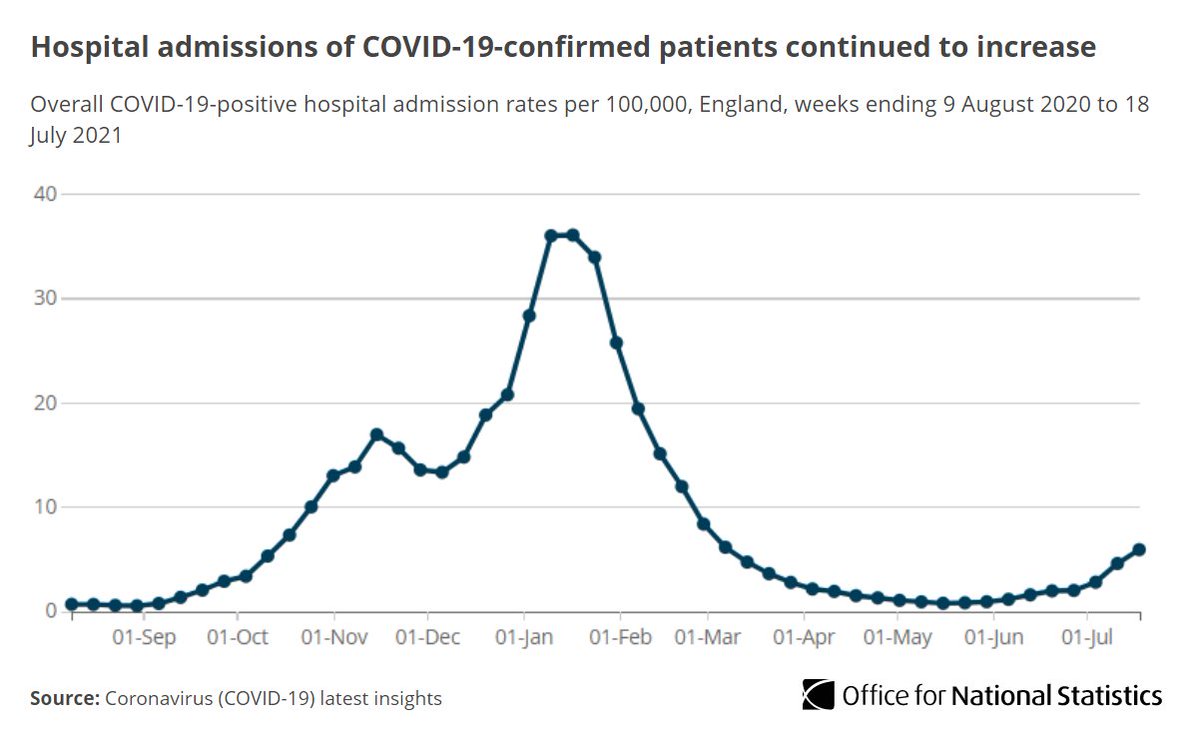
Hospital admissions increased by 29% to a rate of 5.88 per 100,000 people in the week ending 18 July, over three times the rate seen four weeks ago.
Rates increased in all English regions, except in London where rates are similar to the previous week ow.ly/XNID50FCaG8
Rates increased in all English regions, except in London where rates are similar to the previous week ow.ly/XNID50FCaG8
• • •
Missing some Tweet in this thread? You can try to
force a refresh


