The Honest Broker Profile picture
Jul 23, 2021 11 tweets 4 min read Read on X
A short 🧵 on my Senate testimony earlier this week
With key highlights

You can find the full text here:
banking.senate.gov/imo/media/doc/…
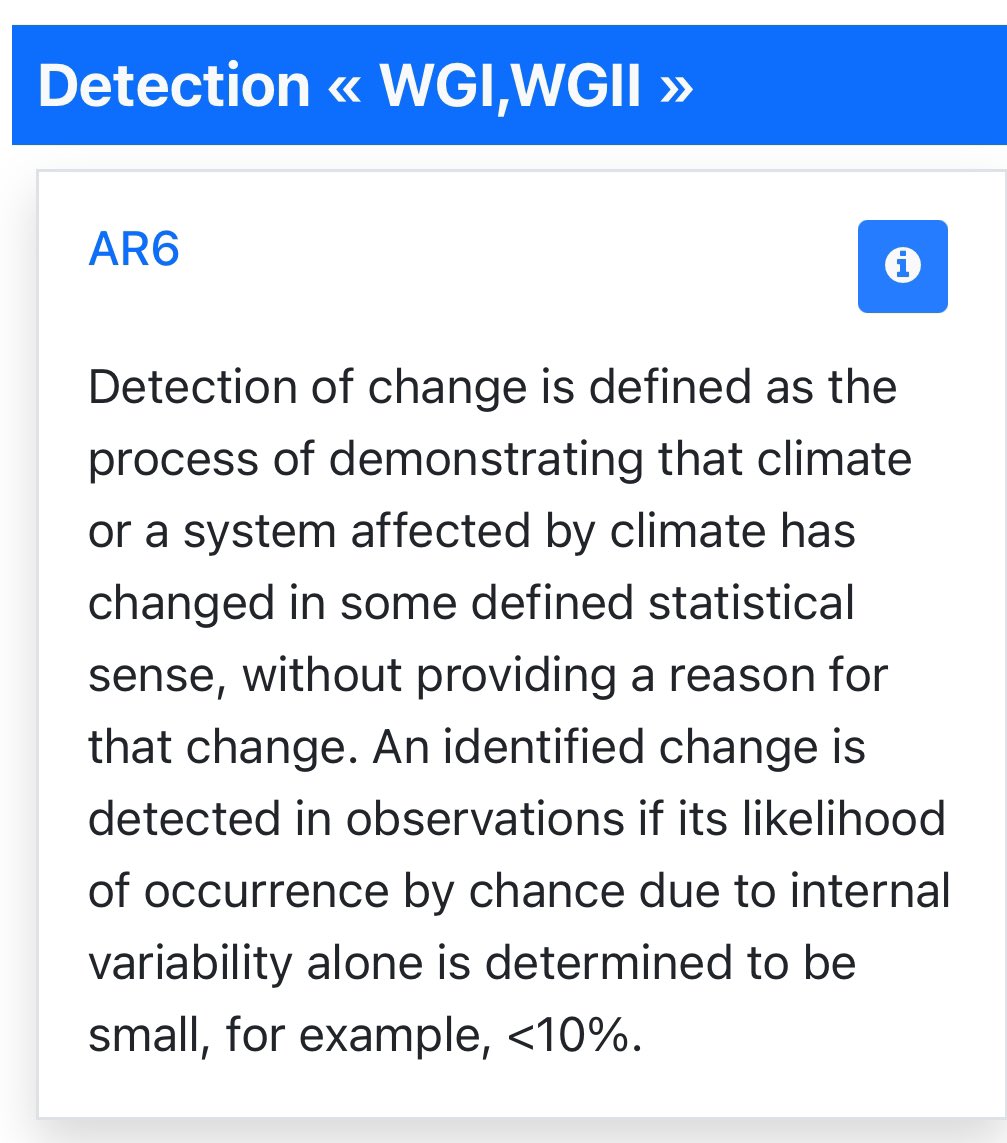
My focus is on the provision of robust science advice to policy makers on climate & evidence that scientific integrity has suffered in key ways

But first, lest there be any confusion. . .

1⃣ Those who are familiar with my views will know the below Image
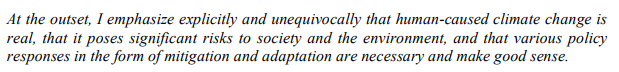
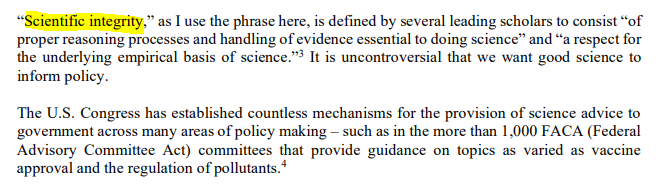
2⃣ Scientific integrity would seem to a a topic that both Democrats and Republicans should be able to agree on

The US government generally (but definitely not always!) does an excellent job in soliciting and securing robust expert advice

Climate should be no different Image
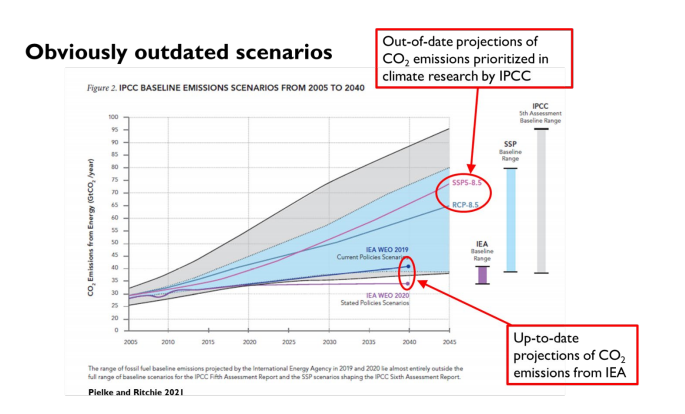
3⃣ Anyone following me knows climate science currently has some serious issues with the ubiquity of out-of-date scenarios

This is not simply an academic issue

Out-of-date scenarios can be found in scenarios used in important policy setting (eg, in regulation, by central banks) Image
Policymakers & the public are routinely provided misinformation by NOAA (one of my favorite science agencies!) w/ the count of so-called "billion dollar disasters"

The dataset is poor economics & inappropriate for measuring climate trends

It's clickbait, apparently irresistible Image
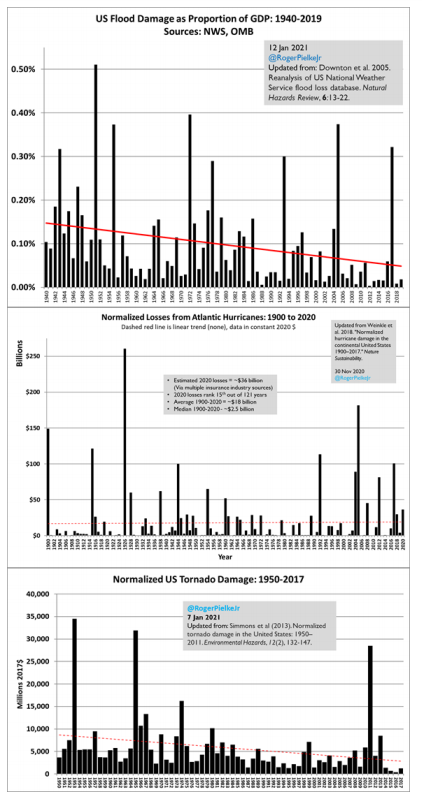
In reality the US & world economies hv become more resilient & less vulnerable to extremes

eg, flood damage as a % of US GDP has dropped by 70% since 1940 - this is not a small decrease

Normalized hurricane & tornadoes losses below also

It is good news & we want it to continue Image
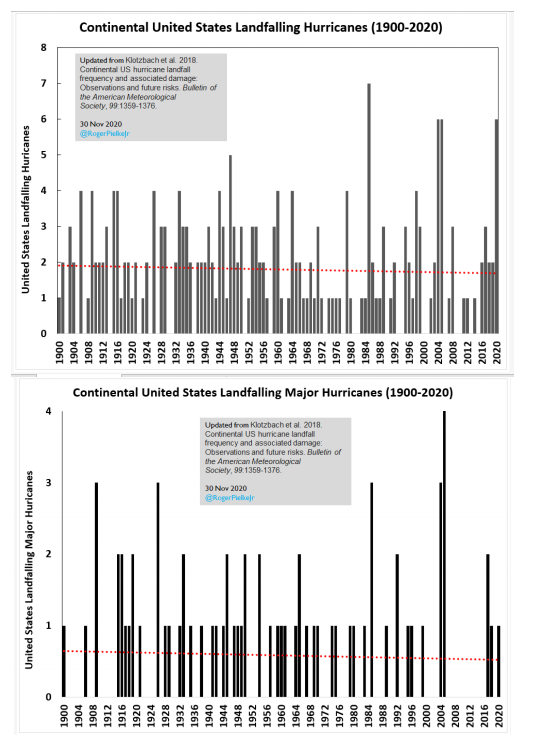
Can you believe that the 2017 and 2018 US National Climate Assessment did not include a graph showing a timeseries of US hurricane landfalls?

Hurricanes by far have the greatest economic damage of extreme weather

And yet the NCA didn't share with policy makers a timeseries?
🤷‍♂️ Image
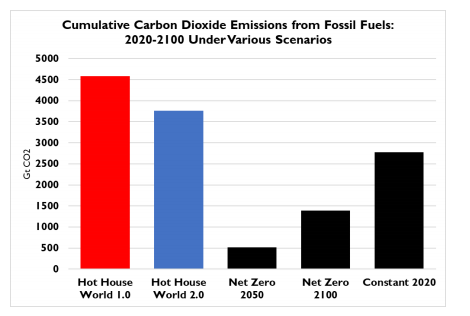
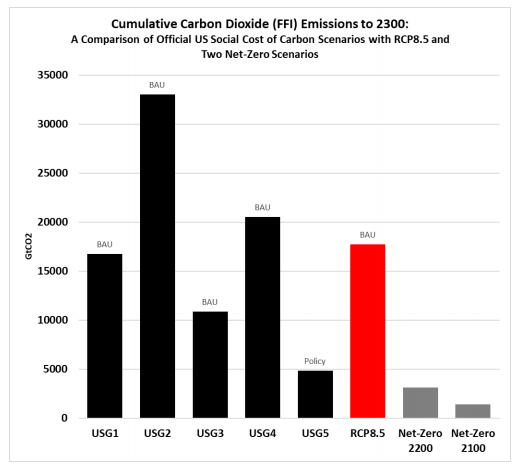
4⃣ Here are two examples where flawed science advice has real-world policy consequences: central bank climate stress testing & estimates of the "social cost of carbon" for regulatory policies

Both based on wildly out-of-date scenarios which project implausible futures (below) ImageImage
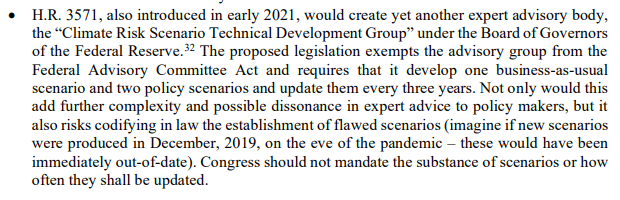
And rather than use existing science advisory mechanisms on climate, Congress is considering creating more such mechanisms, which would risk a confusing landscape of committees and create more opportunities for "policy based evidence" by mandating the substance of its advice Image
5⃣ Congress has the ability to require that the US NCA up its game & provide robust science advice (and just just that which advances the administration's policy agenda)

I recommend three actions to improve the role of the NCA in supporting Congress and the federal agencies
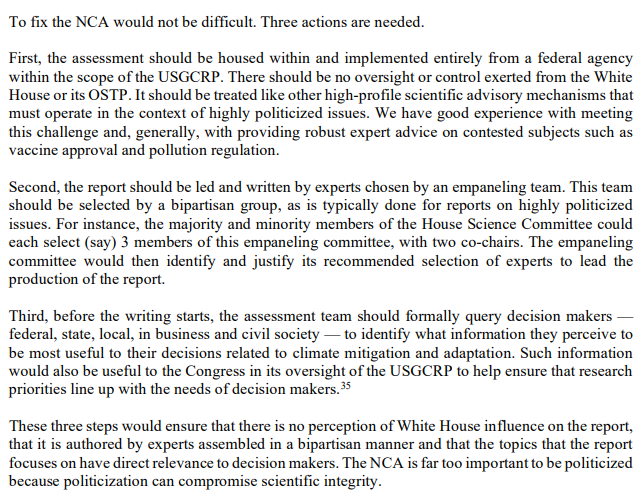
 Image
The bottom line?

At present there are troubling signs that Congress and the federal agencies are not receiving the high-quality advice necessary to inform decision making on climate mitigation and adaptation policies

Climate is too important for bad advice

/END

• • •

Missing some Tweet in this thread? You can try to force a refresh
 

Keep Current with The Honest Broker

The Honest Broker Profile picture

Stay in touch and get notified when new unrolls are available from this author!

Read all threads

This Thread may be Removed Anytime!

PDF

Twitter may remove this content at anytime! Save it as PDF for later use!

Try unrolling a thread yourself!

how to unroll video
  1. Follow @ThreadReaderApp to mention us!

  2. From a Twitter thread mention us with a keyword "unroll"
@threadreaderapp unroll

Practice here first or read more on our help page!

More from @RogerPielkeJr

Aug 7, 2025
🧵The US National Climate Assessment has been a politiczed mess from the start due to its institutional design, which places it in the White House

The NCA proved too tempting for both Ds and Rs to put a thumb on the scale

Links at end of thread . . .
The idea it was perfect under Democrats, as @afreedma & other advocacy journos suggest, is simply wrong

The most recent NCA was totally capture by interest groups and companies that would benefit from the report - UCS, TNC, EDF, CAP, Stripe etc

Below just a few of its authors Image
@afreedma The head of the NCA5 stated publicly that she would never cite our work in the assessment, even though our work is by far the most cited research on economic losses in the US associated with floods, hurricanes, tornadoes

Here is how the NCA handled a reviewer comment Image
Read 7 tweets
Jul 31, 2025
🧵Let's take a quick look at the implications of the regulations that have followed from the 2009 EPA endangerment finding

According to @C2ES_org the 2021 GHG standards for light vehicles would reduce projected CO2 emissions by a cumulative 3.1 billion tons to 2050
c2es.org/content/regula…Image
Over the next 25 years the world would emit 925 gigatons of CO2 assuming constant 2025 emissions and ~690Gt assuming emissions are cut in half by 2050

That means that the projected impact of the regulations would reduce global emissions by 0.0003% (constant) & 0.0004% (halved)
The idea that CO2 can be regulated out of the economy is flawed

If the purpose of CO2 regulation is to create a shadow carbon tax, then it is a horribly inefficent way to do that

Once again, all this leads us back to Congress and the need for smart energy & climate policy
Read 4 tweets
Jan 11, 2025
🧵
The percentage of a percentage trick is increasingly common & leads to massive confusion

Here a undetectable difference of 0.01 events per year per decade is presented as the difference between a 31% and 66.4% increase (in the *likelihood* of the event, not the event itself) Image
The resulting confusion is perfectly predictable

Here is a reporter (NPR) explaining completely incorrectly:
"The phenomenon has grown up to 66% since the mid-20th century"

False Image
Also, the numbers in the text and figure do not appear to match up
I asked Swain about this over at BlooSkeye Image
Read 4 tweets
Dec 22, 2024
The new hurricane damage time series trick

Step 1: create Frankenstein dataset w/ an increasing trend where there was not an increasing trend before

Step 2: Attribute the increasing trend to climate change

Step 3: Use Frankenstein dataset to impeach other research w/ no trend Image
The reason that the blue and red numbers are different is that they are different measures of hurricane losses

E.g., the red numbers include inland NFIP damage
The blue numbers do not, on purpose, because NFIP only started in 1968

They are apples and oranges
Now 3 peer-reviewed papers (PNAS, JAMC, BAMS) make this most basic of errors by replacing and splicing NOAA BDD to the MWR/NHC time series

Predictably all three papers find an increasing trend in normalized hurricane damage even though landfalling hurricanes are not increasing Image
Read 6 tweets
Dec 21, 2024
A Frankenstein dataset results from splicing together two time series found online

Below is an example for US hurricane damage 1900-2017
Data for 1980-2017 was replaced with a different time series in the green box
Upwards trend results (red ---)

Claim: Due to climate change! Image
The errors here are so obvious and consequential that it is baffling that the community does not quickly correct course

Read about it here
Is my analysis flawed?
osf.io/preprints/osf/…
The IPCC AR6 cited a paper misusing the Frankenstein hurricane loss dataset to suggest that NOAA's gold standard hurricane "best track" dataset may be flawed

JFC - Using flawed economic loss data to suggest that direct measurements of hurricanes are in error! Image
Read 6 tweets
Nov 2, 2024
We’ve reached the point where an IPCC author is openly rejecting the conclusions of the IPCC out of concern over how their political opposition is correctly interpreting the AR6

The integrity of the IPCC on extreme events is now under attack
The IPCC explains that a trend in a particular variable is DETECTED if it is outside internal variability and judged with >90% likelihood

For most (not all) metrics of extreme weather detection has not been achieved

That’s not me saying that, but IPCC AR6 Image
The IPCC also assesses that for most (but not all) metrics of extreme weather the signal of a change in climate will not emerge from internal variability with high confidence (ie, >90%) by 2050 or 2100, even assuming the most extreme changes under RCP8.5 Image
Read 6 tweets

Did Thread Reader help you today?

Support us! We are indie developers!


This site is made by just two indie developers on a laptop doing marketing, support and development! Read more about the story.

Become a Premium Member ($3/month or $30/year) and get exclusive features!

Become Premium

Don't want to be a Premium member but still want to support us?

Make a small donation by buying us coffee ($5) or help with server cost ($10)

Donate via Paypal

Or Donate anonymously using crypto!

Ethereum

0xfe58350B80634f60Fa6Dc149a72b4DFbc17D341E copy

Bitcoin

3ATGMxNzCUFzxpMCHL5sWSt4DVtS8UqXpi copy

Thank you for your support!

Follow Us!

:(