Zeke Hausfather Profile picture
Jul 26, 2021 8 tweets 3 min read Read on X
Summer 2021 has seen record heat waves (and the hottest June on record over land regions), as well as extreme flooding. In our Q2 2021 State of the Climate update, we look back at the first six months of the year and what the next six months may hold: carbonbrief.org/state-of-the-c… Image
Despite record summer heat in some areas, globally the year has been a bit cooler than the last few so far; 2021 is the seventh warmest year on record to-date. That still means its warmer than all but seven years since record began in the mid-1800s! Image
Here is 2021 to-date in context of the long-term warming across the five major global temperature records (NASA, NOAA, Hadley/UEA, Berkeley Earth, and Copernicus/ECMWF): Image
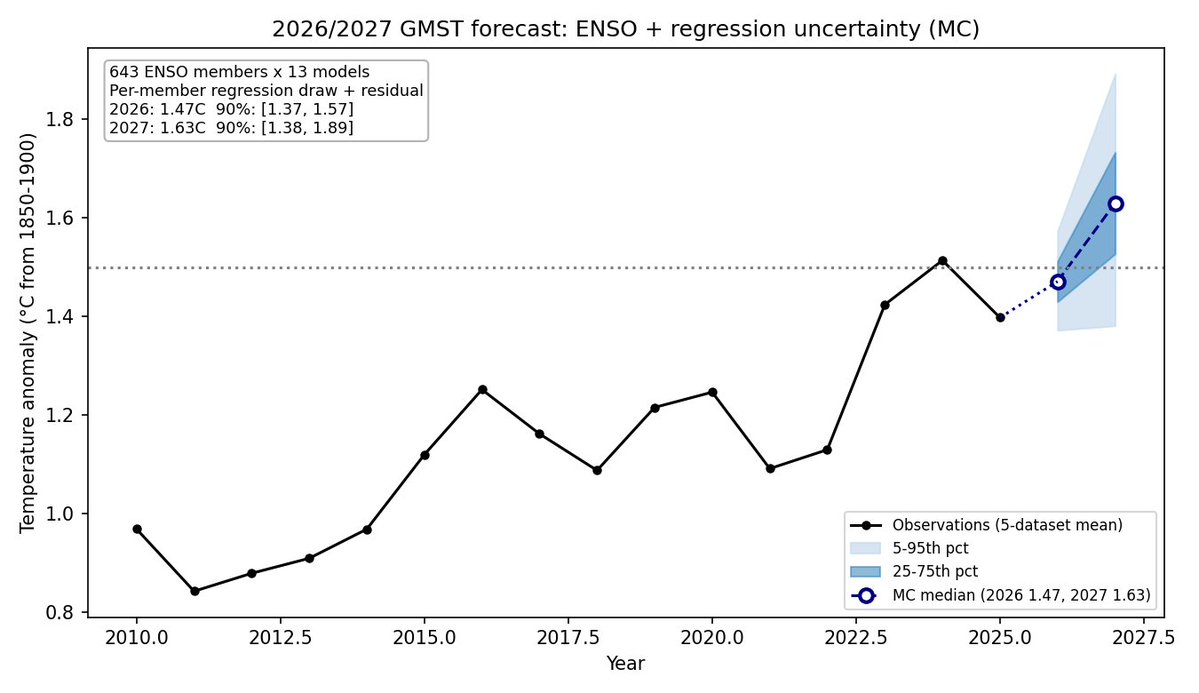
Based on the first six months of the year and the El Nino/La Nina forecast, we can estimate where 2021 will end up. We find that it will very likely be somewhere between the 5th and 7th warmest year on record, consistent with the long-term warming trend: Image
This suggests that the remaining months of the year will likely be a bit warmer (in terms of temperature anomalies) than the first six months of the year, driven in part by the fading La Nina event that drove down early 2021 temperatures: Image
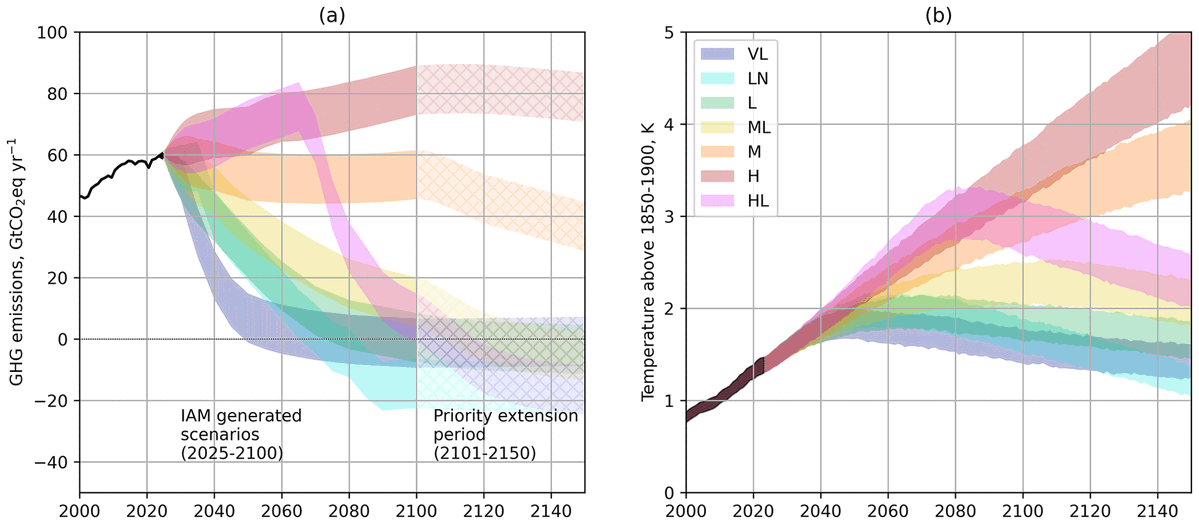
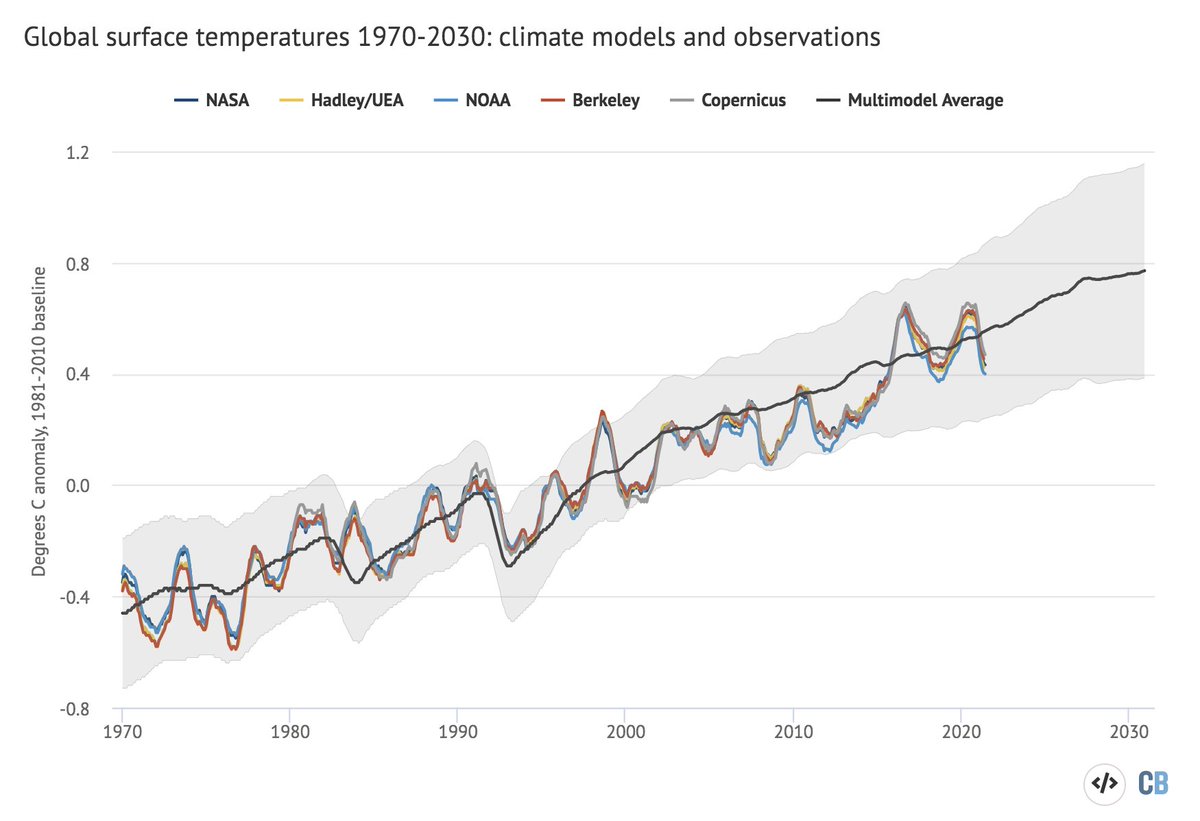
Global temperatures are pretty well in-line with where climate models in the last IPCC report (published in 2013) projected they would be: Image
Finally, Arctic sea ice has been at record lows for this time of the year for much of July, though it is too early to tell what the September sea ice minimum will end up being. Antarctic sea ice has been pretty normal (relative to the 1981-2010 period) so far this year: Image
For more details (and more on recent climate extremes), read the Q2 2021 State of the Climate article: carbonbrief.org/state-of-the-c…

• • •

Missing some Tweet in this thread? You can try to force a refresh
 

Keep Current with Zeke Hausfather

Zeke Hausfather Profile picture

Stay in touch and get notified when new unrolls are available from this author!

Read all threads

This Thread may be Removed Anytime!

PDF

Twitter may remove this content at anytime! Save it as PDF for later use!

Try unrolling a thread yourself!

how to unroll video
  1. Follow @ThreadReaderApp to mention us!

  2. From a Twitter thread mention us with a keyword "unroll"
@threadreaderapp unroll

Practice here first or read more on our help page!

More from @hausfath

Jan 16
Every wildfire starts with an ignition – downed powerlines, lightning, arson – and we can do a lot to reduce these.

But in California the number of fires has dropped while the area burned has doubled. What has changed is conditions, not ignitions: Image
Why have conditions changed? A legacy of poor forest management has led to fuel loading (particularly in the Sierras), contributing to more destructive fires. But vegetation has also gotten much drier as fire season temperatures have warmed (+3.6F since 1980s) Image
We've historically seen the most destructive fires in hot and dry years. Human emissions of CO2 and other greenhouse gases are the primary cause of increased temperatures in California. Image
Read 4 tweets
Jan 15
I have a new paper in Dialogues on Climate Change exploring climate outcomes under current policies. I find that we are likely headed toward 2.7C by 2100 (with uncertainties from 1.9C to 3.7C), and that high end emissions scenarios have become much less likely Image
This reflects a bit of good news; 2.7C is a lot better than the 4C that many thought we were heading for a decade ago, and reflects real progress on moving away from a 21st century dominated by coal. At the same time, its far from what is needed. Image
It does raise an interesting question: how much of the change in likely climate outcomes relative to a decade ago reflects actual progress on technology and policy vs assumptions about the future (e.g. 5x more coal by 2100) that were always unrealistic.
Read 11 tweets
Jan 6
I have a new analysis over at The Climate Brink exploring how rates of warming have changed over the past century.

Post-1970, GHGs (CO2, CH4, etc.) would have led to just under 0.2C per decade, but falling aerosols (SO2) have increased that rate to 0.25C. Image
These falling aerosols have "unmasked" of some of the warming that would have otherwise occurred due to past emissions of greenhouse gases. Its been driven by large declines in Chinese and shipping SO2 emissions over the past decade, among other contributors. Image
Now, a flat rate of warming from GHGs at just under 0.2C per decade might seem a bit unexpected. After all, CO2 emissions have continued to increase, and atmospheric CO2 concentrations have grown year over year.
Read 8 tweets
Sep 24, 2024
Theres been a bit of confusion lately around how the climate system response to carbon dioxide removal. While there are complexities, under realistic assumptions a ton of removal is still equal and opposite in its effects to a ton of emissions.

A thread: 1/x Image
When we emit a ton of CO2 into the atmosphere, a bit more than half is reabsorbed by the ocean and the biosphere today (though this may change as a warming world weakens carbon sinks). Put simply, 2 tons of CO2 emissions -> 1 ton of atmospheric accumulation. Image
Carbon removal (CDR) is subject to the same effects; if I remove two tons of CO2 from the atmosphere, the net removal is only one ton due to carbon cycle responses. Otherwise removal would be twice as effective as mitigation, which is not the case.
Read 11 tweets
Aug 14, 2024
The carbon cycle has been close to equilibrium through the Holocene; we know this because we measure atmospheric CO2 concentrations in ice cores. But in the past few centuries CO2 has increased by 50%, and is now at the highest level in millions of years due to human emissions. Image
Starting 250 years ago, we began putting lots of carbon that was buried underground for millions of years into the atmosphere. All in all we’ve emitted nearly 2 trillion tons of CO2 from fossil fuels, which is more than the total mass of the biosphere or all human structures: Image
About a trillion of that has accumulated in the atmosphere, increasing CO2 concentrations to levels last seen millions of years ago. The remainder was absorbed by the biosphere and oceans. We can measure these sinks, and it’s incontrovertible that they are indeed net carbon sinks Image
Read 7 tweets
Jul 24, 2024
We just published our State of the Climate Q2 update over at @CarbonBrief:

⬆️ Now a ~95% chance 2024 will be the warmest year on record.
⬆️ 13 month streak of records set between June 2023 and June 2024.
⬆️ July 22nd 2024 was the warmest day on record (in absolute terms).
⬇️ July 2024 will very likely come in below July 2023, breaking the record streak.
⬇️ The rest of 2024 is likely to be cooler than 2023 as El Nino fades and La Nina potentially develops.
⬇️ Second lowest Antarctic sea ice on record.carbonbrief.org/state-of-the-c…Image
The past 13 months have each set a new record, with 2024 being quite a bit warmer than 2023 (at ~1.63C above preindustrial levels) in the ERA5 dataset: Image
However, the margin by which records are being set has shrunk; global temperatures were setting new records by a stunning 0.3C to 0.5C in the second half of 2023, but have been breaking the prior records (set in 2016, 2020, or 2023) by only 0.1C to 0.2C this year: Image
Read 7 tweets

Did Thread Reader help you today?

Support us! We are indie developers!


This site is made by just two indie developers on a laptop doing marketing, support and development! Read more about the story.

Become a Premium Member ($3/month or $30/year) and get exclusive features!

Become Premium

Don't want to be a Premium member but still want to support us?

Make a small donation by buying us coffee ($5) or help with server cost ($10)

Donate via Paypal

Or Donate anonymously using crypto!

Ethereum

0xfe58350B80634f60Fa6Dc149a72b4DFbc17D341E copy

Bitcoin

3ATGMxNzCUFzxpMCHL5sWSt4DVtS8UqXpi copy

Thank you for your support!

Follow Us!

:(