The pandemic changed nearly every aspect of our lives -- work, play, parenting, even sleep. But it didn't affect everyone the same way.
@ellawinthrop & I dove deep into the American Time Use Survey to see the effects of Covid, and how we adapted to it.
nytimes.com/interactive/20…
@ellawinthrop & I dove deep into the American Time Use Survey to see the effects of Covid, and how we adapted to it.
nytimes.com/interactive/20…
Note: The pandemic also disrupted data collection itself, so all these charts are for May 10 - Dec. 31, after the most intense periods of lockdown. So think of it as a glimpse of how we lived life as the pandemic dragged on.
We spent a lot less time with people outside our own households in 2020 and a lot more time alone. Seniors spent the most time alone (8+ waking hours), but it was young ppl who experienced the biggest change. Teens (15-19) went from spending 4.5 hours alone in 2019 to 6 in 2020. 

What did we do with the extra time? More screen time, more phone/video calls, more cooking. Some interesting tidbits in the breakdowns here: Young people (unlike everyone else) spent *more* time grooming last year, but less time exercising.

You've heard (or experienced!) a lot about parenting in the pandemic, but the time-use numbers are still revealing. Mothers of school-age children (6-12) spent *8 hours a day* taking care of kids in 2020, two hours more than in 2019. (Dads spent about 5.5 hours.)

(Note that these parenting charts include both "primary" and "secondary" childcare -- i.e. time spent directly caring for children and time watching the kids while doing other things. The latter experienced by far the bigger increase.)
More time with the kids meant more time cooking while parenting, more time cleaning while parenting, and especially more time working while parenting. Mothers of school-age children spent 48 more minutes on average working while parenting in 2020.

Note that's an average for ALL women with kids ages 6-12, including those who didn't work at all. If you look only at women who worked, they spent close to two more hours a day parenting-while-working than in 2019. (Dads spent an extra 45 minutes.)
In married households, men and women shouldered the extra childcare burden fairly equally (although moms still did much more overall). But single moms took on a ton of extra childcare work -- nearly three more hours a day.
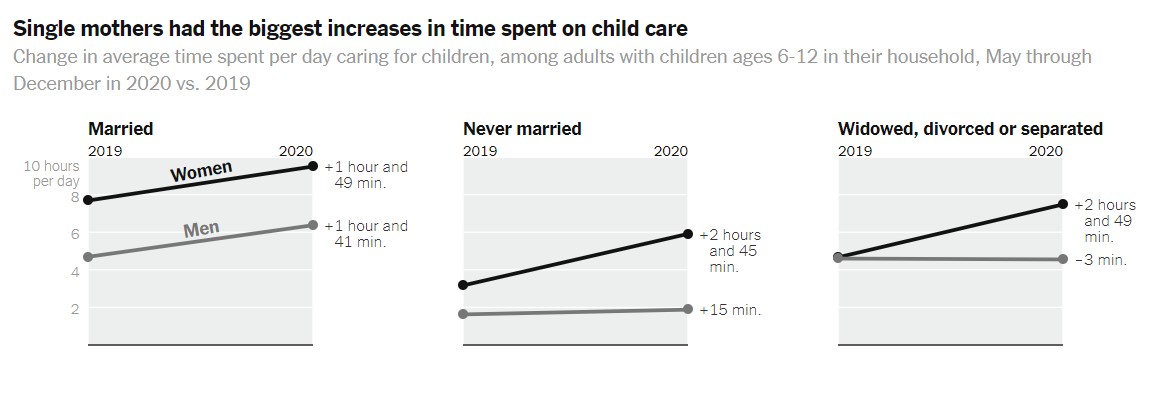
Note: I didn't distinguish here between same-sex and opposite-sex couples. BLS, which oversees the survey, codes everyone as "male" or "female," so we don't have data on people identifying in other ways.
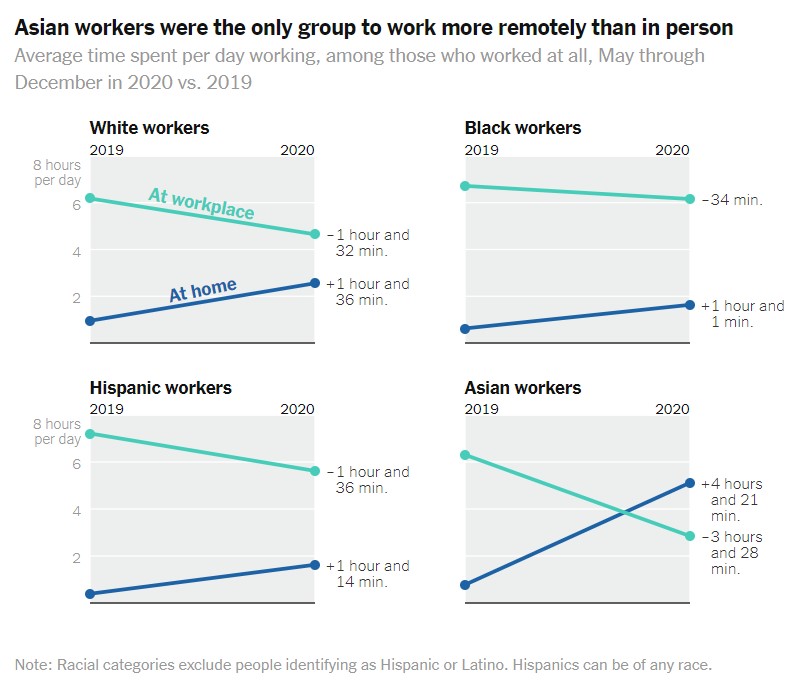
Americans on average worked less in 2020, but that's because fewer people were working. Among those who did work, total hours per day changed little. But *where* those hours were worked changed a lot.

Looking at the data month by month, a slim majority of working hours were done from home in May. (Recall that we don't have March/April data.) But after that, most people were back at their workplaces.
Work is where we see some of the starkest racial and socioeconomic divides. Hispanic and Latino workers were more likely to lose jobs; Black workers were more likely to have to keep working in person. White and Asian workers were much more likely to be able to work from home.
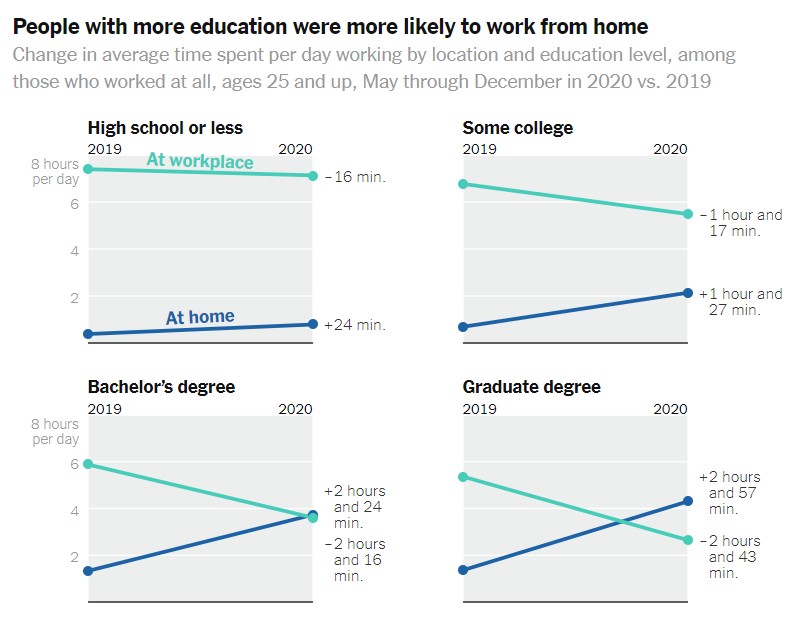
If you have a graduate degree, chances are you were working from home last year (or still are now). If you have a high school diploma or less, you probably had to keep going in person all year, if you kept your job at all.
More tidbits in our story, so have a look. And there is TONS more to explore in this data, so if you've got ideas, send 'em my way. Thanks to @ellawinthrop for the amazing graphics.
nytimes.com/interactive/20…
nytimes.com/interactive/20…
• • •
Missing some Tweet in this thread? You can try to
force a refresh