Accounting is the language of business.
If you buy stocks, you MUST learn how to read an income statement
Here’s everything you need to know:
If you buy stocks, you MUST learn how to read an income statement
Here’s everything you need to know:
The income statement shows a company’s revenue and expenses over a period of time.
It’s also called a Profit and Loss statement, or “P & L”
It’s also called a Profit and Loss statement, or “P & L”
The most common time periods are:
▪️1 Quarter / 90 days
▪️1 Year / 365 days
▪️TTM /“Trailing Twelve Months”
▪️YTD / “Year To Date”
Some companies report 6 months & 9 months, too
▪️1 Quarter / 90 days
▪️1 Year / 365 days
▪️TTM /“Trailing Twelve Months”
▪️YTD / “Year To Date”
Some companies report 6 months & 9 months, too
Companies usually show the income statement in the quarterly earnings press release, but not always
You can find them by looking at:
▪️10-Q (quarterly report)
▪️10-K (annual report)
▪️Financial websites such as @theTIKR,
@CMLviz, @themotleyfool, or @KoyfinCharts
You can find them by looking at:
▪️10-Q (quarterly report)
▪️10-K (annual report)
▪️Financial websites such as @theTIKR,
@CMLviz, @themotleyfool, or @KoyfinCharts

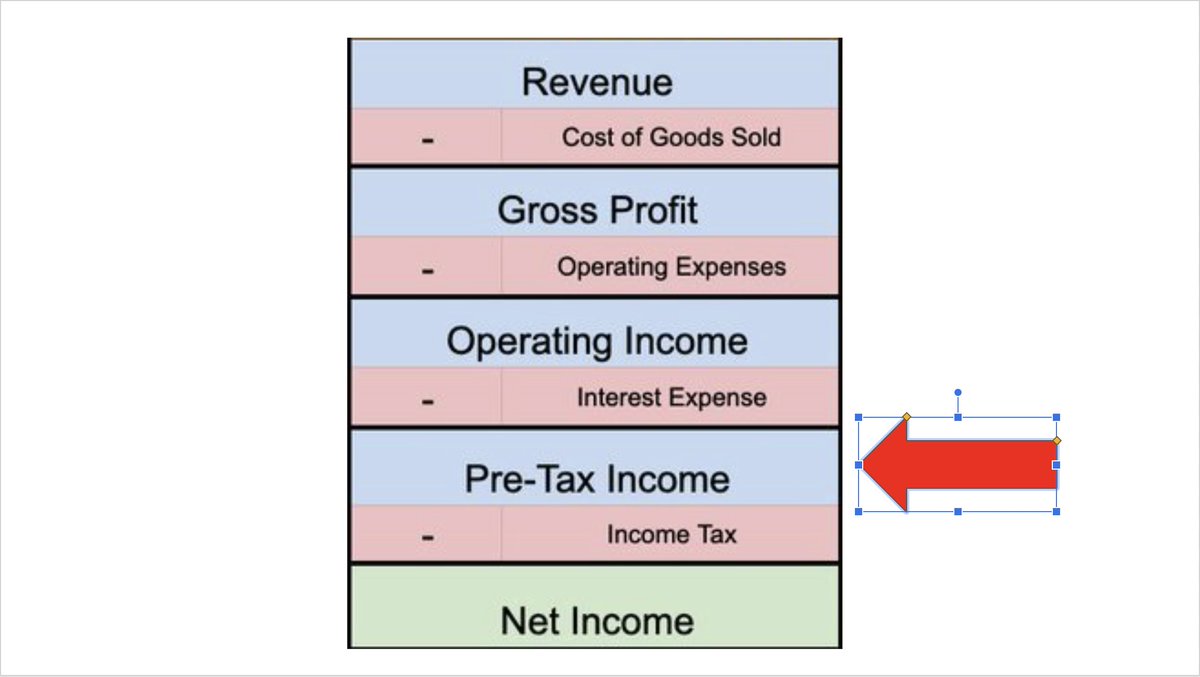
The income statement flows in a step-down manner.
The top number is revenue (sales) and costs are subtracted as you go down.
In the U.S., the income statement follows this basic format (there are exceptions):
The top number is revenue (sales) and costs are subtracted as you go down.
In the U.S., the income statement follows this basic format (there are exceptions):

Let's take them one at a time
1: Revenue
This is the amount received or to be received from the sales of products/services to customers during the period.
Sales revenue is net, meaning it includes discounts, returns, and any other deductions from the sales price.
1: Revenue
This is the amount received or to be received from the sales of products/services to customers during the period.
Sales revenue is net, meaning it includes discounts, returns, and any other deductions from the sales price.

2: Cost of Goods Sold (COGS)
This figure shows all of the costs & expenses related to producing the product and/or service.
If you sell calculators, this would be the variable costs of:
▪️Chips
▪️Memory
▪️Plastic
▪️Labor costs
▪️Etc...
to manufacture the calculators.
This figure shows all of the costs & expenses related to producing the product and/or service.
If you sell calculators, this would be the variable costs of:
▪️Chips
▪️Memory
▪️Plastic
▪️Labor costs
▪️Etc...
to manufacture the calculators.

4a: Operating Expenses (OPEX)
A catchall category that includes all costs to run a company’s day-to-day operations.
Some companies show detailed costs. Others lump it all together.
A catchall category that includes all costs to run a company’s day-to-day operations.
Some companies show detailed costs. Others lump it all together.

4b:
Common categories include:
▪️Research & Development (R&D)
▪️Sales
▪️Marketing
▪️Selling, General & Administrative (SG&A)
▪️Overhead (rent, utilities, travel, salary, bonus, stock-based compensation)
OPEX is usually a company’s largest expense.
Common categories include:
▪️Research & Development (R&D)
▪️Sales
▪️Marketing
▪️Selling, General & Administrative (SG&A)
▪️Overhead (rent, utilities, travel, salary, bonus, stock-based compensation)
OPEX is usually a company’s largest expense.
5: Operating Income
Gross Profit - OPEX
This shows how much profit a company earned from its ongoing operations.
It can also be called “EBIT”, which stands for “Earnings Before Interest and Taxes”.
Gross Profit - OPEX
This shows how much profit a company earned from its ongoing operations.
It can also be called “EBIT”, which stands for “Earnings Before Interest and Taxes”.

6: Interest Expense
The amount of interest paid during the period.
This can also include other types of financing charges like loan origination fees.
(This can also be a positive number if the company generates more interest than it spends)
The amount of interest paid during the period.
This can also include other types of financing charges like loan origination fees.
(This can also be a positive number if the company generates more interest than it spends)

9: Net income
We made it to “the bottom line”, which is also called “earnings” or “profits”
If this number is positive, the business is "profitable"
If this number is negative, the business is "unprofitable"
(As always, there's nuance)
We made it to “the bottom line”, which is also called “earnings” or “profits”
If this number is positive, the business is "profitable"
If this number is negative, the business is "unprofitable"
(As always, there's nuance)

10: After we have found net income, we need to divvy it up!
If a company makes $10 million and it has 1 million shares outstanding, each share is entitled to $10.
$10 million / 1 million shares = $10 in "earnings per share" or “EPS”
If a company makes $10 million and it has 1 million shares outstanding, each share is entitled to $10.
$10 million / 1 million shares = $10 in "earnings per share" or “EPS”
Income statements are most useful when they are compared to a similar period.
The comparison allows you to tell if a business is growing or shrinking.
Here is $NKE recent income statement, with the change highlighted to show context
The comparison allows you to tell if a business is growing or shrinking.
Here is $NKE recent income statement, with the change highlighted to show context

It can also be very helpful to look at each of these figures on a % of revenue basis.
My favorite numbers to check:
▪️Gross Margin
▪️Operating Margin
▪️Net Margin
Doing so allows you to compare companies of different sizes and see which direction margins are heading.
My favorite numbers to check:
▪️Gross Margin
▪️Operating Margin
▪️Net Margin
Doing so allows you to compare companies of different sizes and see which direction margins are heading.

The income statement can also be useful in determining point-in-time valuations.
The most common metrics are
▪️Price-to-Sales (PS ratio)
▪️Price to EBIT
▪️Price to Earnings (P/E) ratio
These figures are usually calculated using 1-year data
The most common metrics are
▪️Price-to-Sales (PS ratio)
▪️Price to EBIT
▪️Price to Earnings (P/E) ratio
These figures are usually calculated using 1-year data

Want to see an example in more detail?
@brian_stoffel_ and I made a YouTube video where looked at the income statements of a coffee stand & $AAPL
@brian_stoffel_ and I made a YouTube video where looked at the income statements of a coffee stand & $AAPL
Like this thread?
Follow me @brianferoldi
I regularly tweet about money, investing, and personal finance.
Follow me @brianferoldi
I regularly tweet about money, investing, and personal finance.
We will also make videos about the balance sheet, cash flow statement, stock-based comp, and more!
If that interests you, subscribe to my YouTube channel:
youtube.com/brianferoldiyt…
If that interests you, subscribe to my YouTube channel:
youtube.com/brianferoldiyt…
There is A LOT more to the income statement than what is covered here.
Recommended books to learn more:
▪️Warren Buffett & The Interpretation of Financial Statements
▪️Quality of Earnings
▪️Financial Statements: A Step-by-Step Guide
Recommended books to learn more:
▪️Warren Buffett & The Interpretation of Financial Statements
▪️Quality of Earnings
▪️Financial Statements: A Step-by-Step Guide
• • •
Missing some Tweet in this thread? You can try to
force a refresh


