
🔎 I Teach Investors How To Analyze Businesses | Author & Financial Educator | 20+ Years Investing Experience | Building Stock Simplifier ⬇️
 They confused me until I discovered an easy way to distinguish them:
 1: Gross Margin
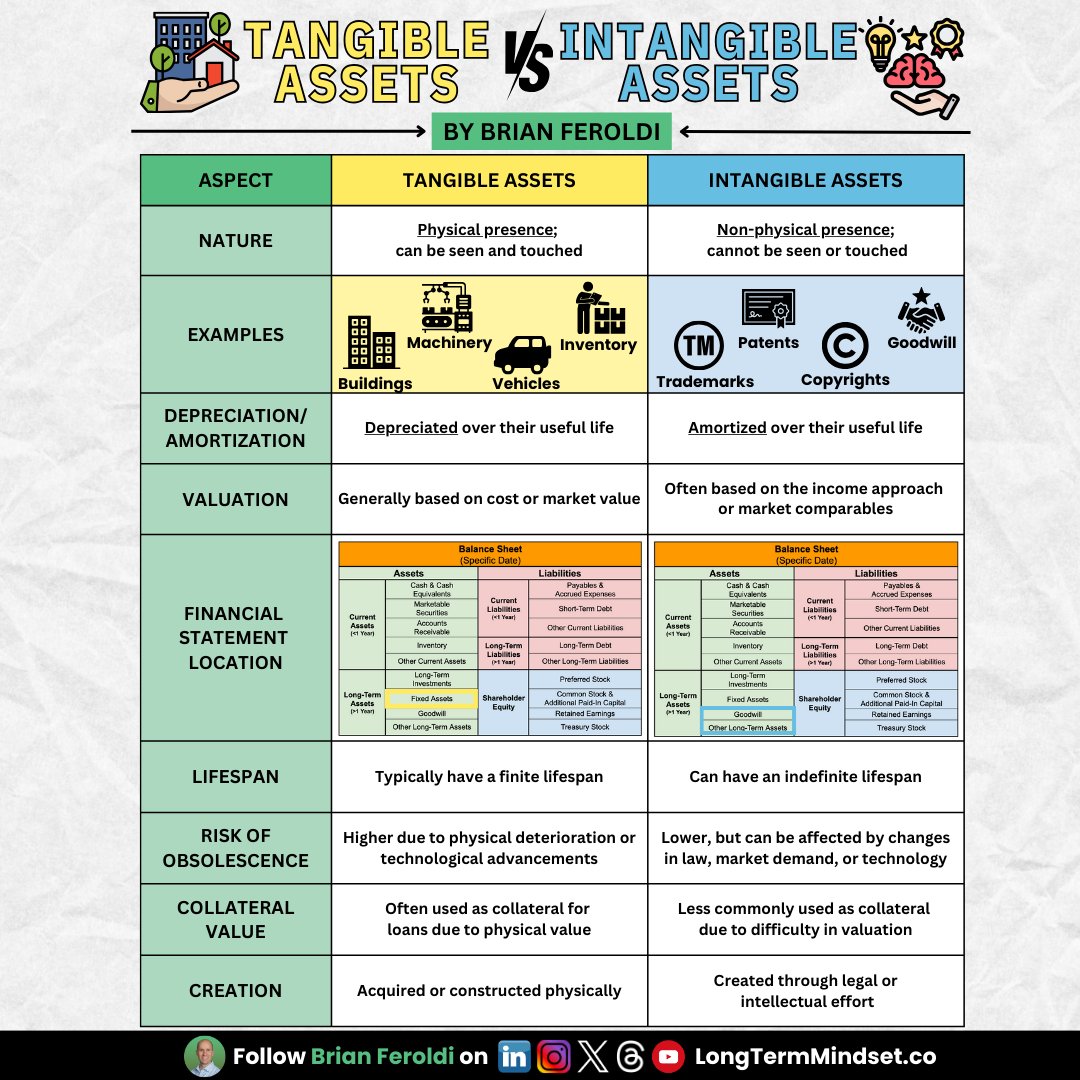
 1) GOODWILL WRITEDOWN
 1: Gross Margin
 The income sheet is one of the three major financial statements.


 The Cash Flow Statement shows how cash moves in and out of a company over a period of time.
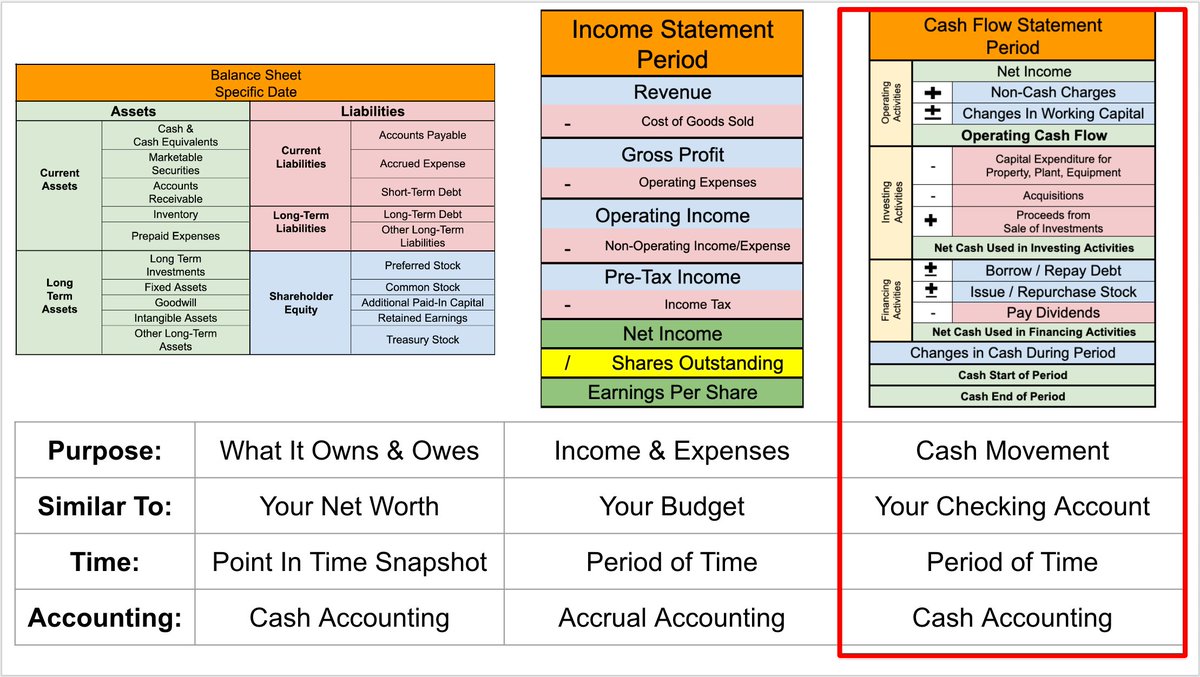
 1: Markets are volatile. Never invest unless you are sure a "margin of safety" exists.
 The P/E ratio's flaw is that the "earnings” can be misleading.
 2: You make far more money by holding through bull markets that you lose by holding through bear markets.
 Business Basics
 Let's say Tom's portfolio is worth $100,000 in the middle of a bull market.
 1. Investing versus speculating
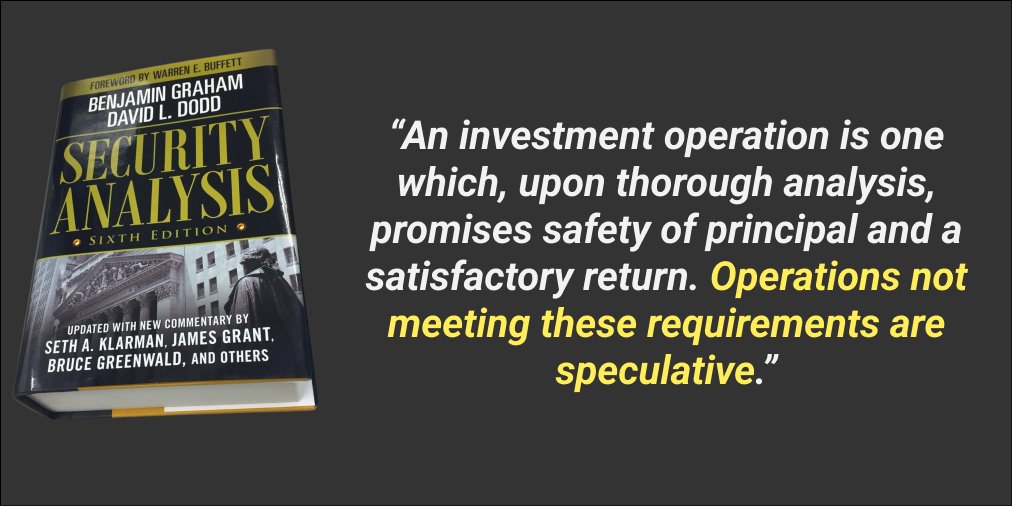
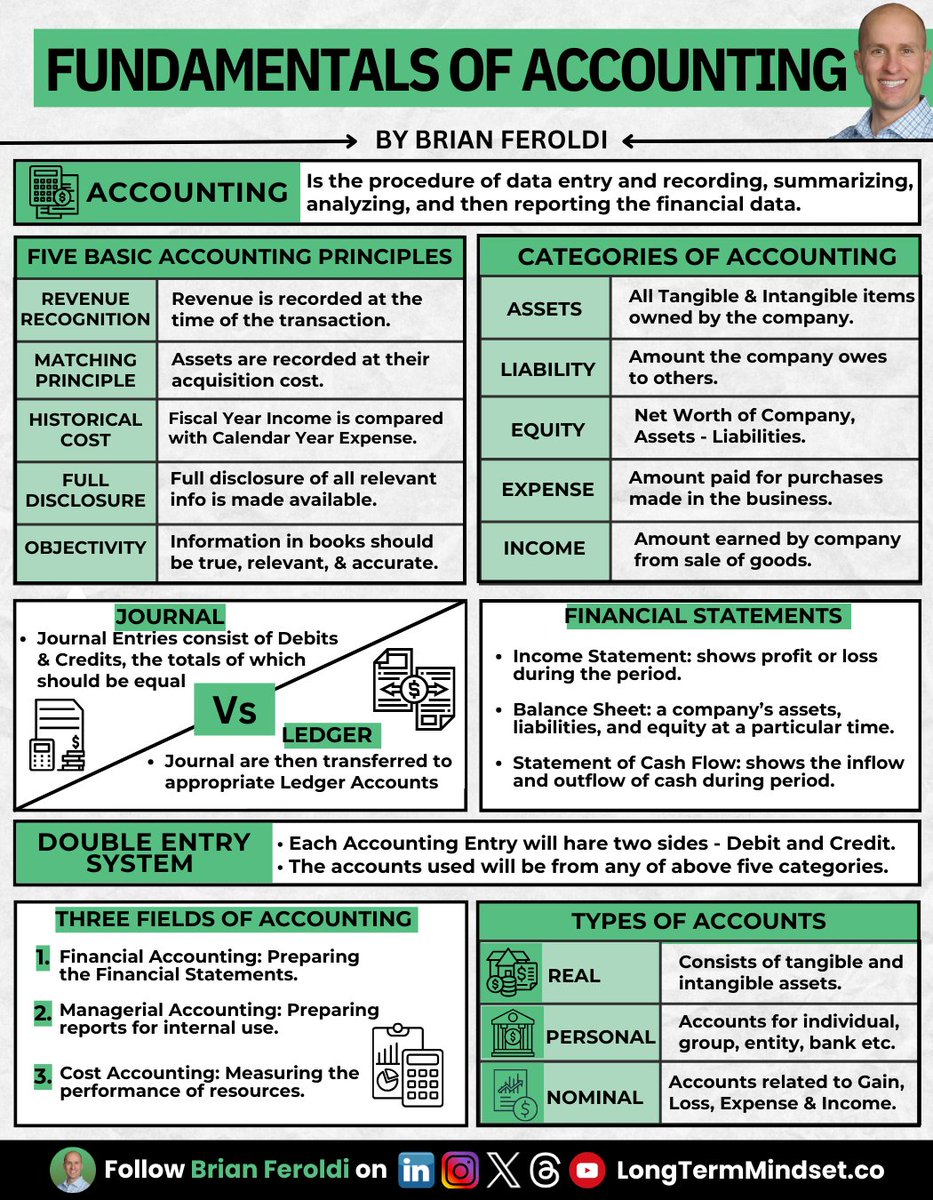 5 Core Accounting Principles:
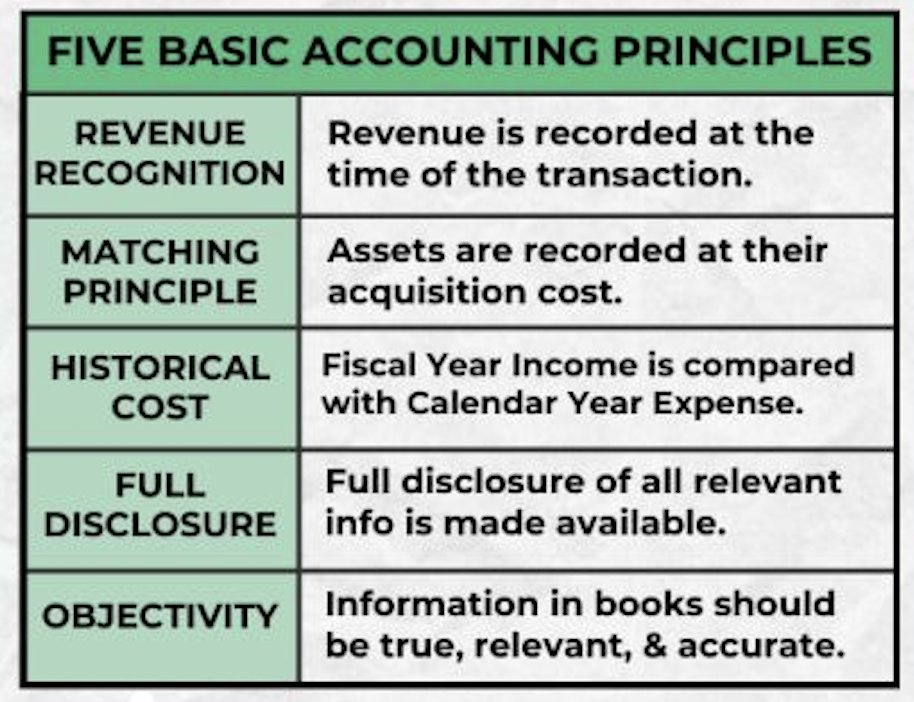
 The P&L (or Income Statement) shows a company's profitability at multiple levels over a period of time using accrual accounting.
 2: You make far more money by holding through bull markets that you lose by holding through bear markets.
 1: Thesis Busted
 2: Three Types of Analysis
 1: Don’t haggle