We show that prior negative results are due to toward-0 bias from Jensen's method when used with small gaps and small sample sizes (unreliability of the gap vectors).
We use data from the awesome Vietnam Experience Study (VES) which has 19 cognitive tests, and all the MMPI-2 items, many of which ask about religious matters.
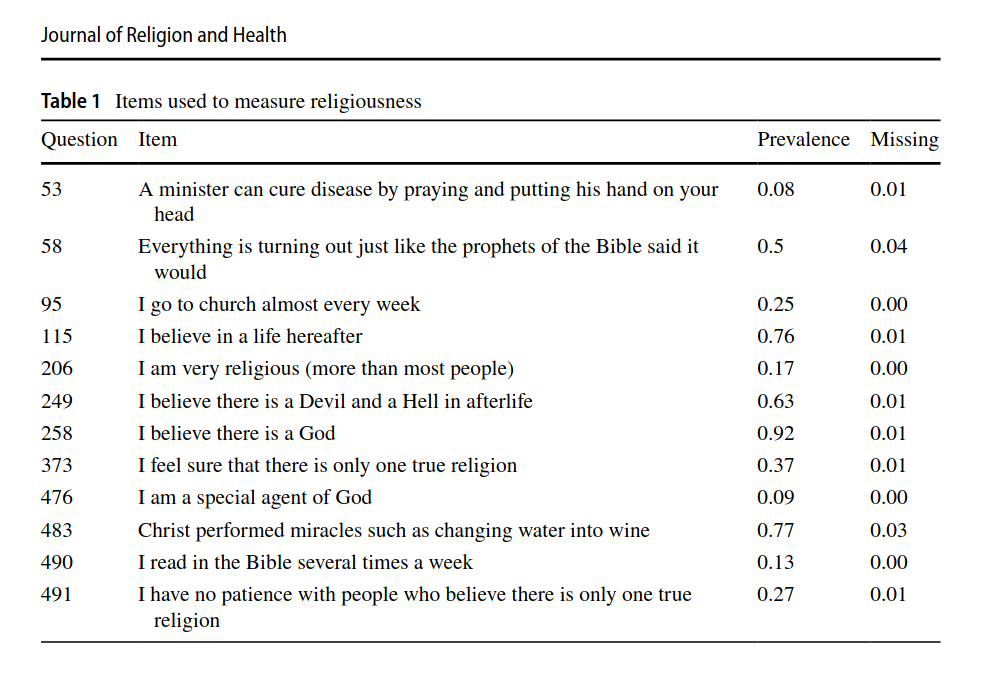
Factor analyzing the religious items yields a kind of semi-continuous religiousness latent variable. This is related to intelligence at -0.20 ish.
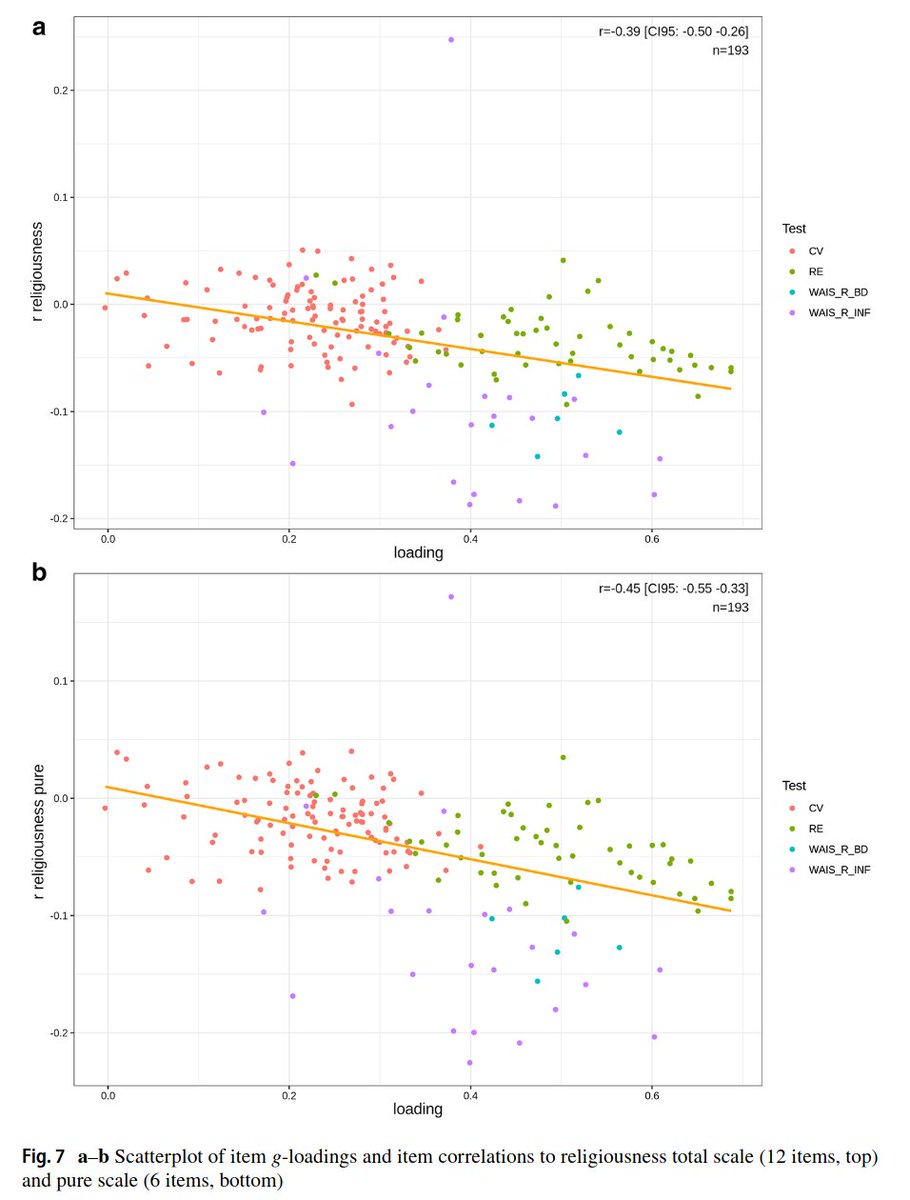
Using our battery of tests, we find the usual strong Jensen pattern.
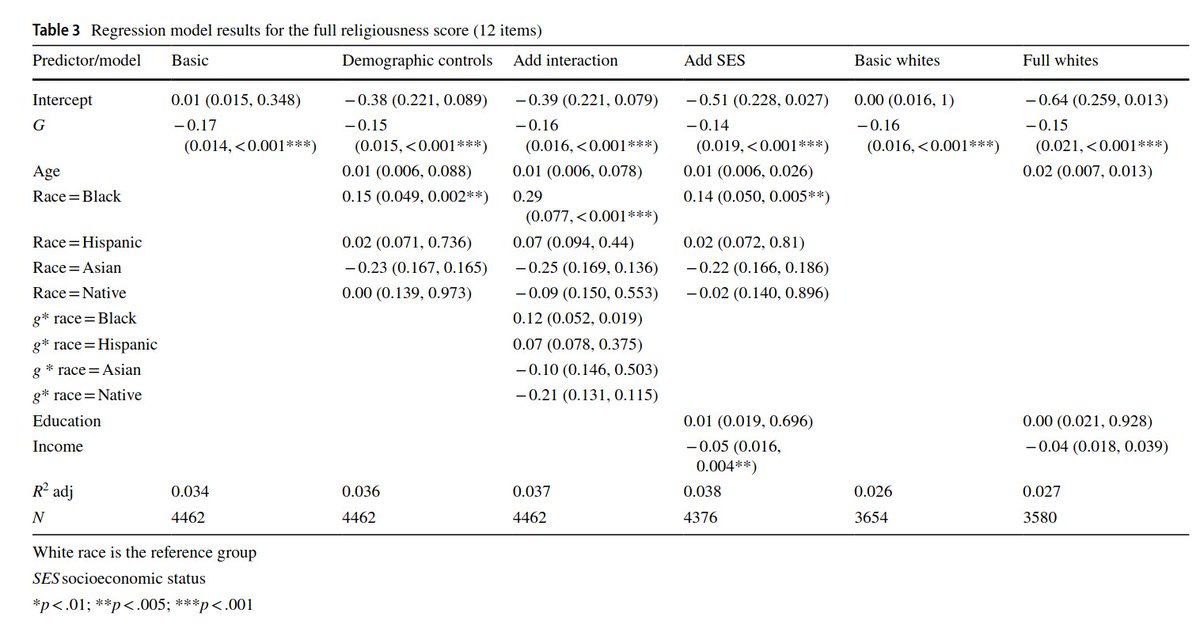
Regression analysis does not show any obvious confounding with age, race, or even education and income. Effect of intelligence seems pretty direct.
We go further. We have access to some 200 items too, and these also show the Jensen pattern. Note the outliers! The one item that is way out of place is WAIS Information 18, which in fact asks about contents of the Bible. Religious people get it right a lot more often.
Finally, we find that the various indicators of religiousness show quite different associations to intelligence. It is mainly the belief-related indicators that relate, not behaviors. This is also true when controls are added.
Paper with @jollyheretic, kudos for the funny title of refuting his own prior paper from last year. 😎
• • •
Missing some Tweet in this thread? You can try to
force a refresh
Our new meta-analysis of American race gaps in IQ/intelligence is out! The main results didn't change that much, with 2 exceptions:
First, there appears to be reverse publication bias for Black IQs, smaller studies find _larger_ values. This is a prediction from leftism bias model, since social scientists hack in the preferred direction, which is usually positive, but sometimes negative. Adjusting for this gives a Black IQ estimate 82 instead of 85.
The formal meta-analysis models did not find any changes over time, but if one looks at the plot, there is some trend, p > 5%.
Happy to release our newest and largest admixture project. 🧵 Thread with the main findings.
First, we compiled data from 100s of sources to estimate genetic ancestry for over 400 units in the Americas. These are countries and subnational divisions of the larger countries, such as US states, Canadian provinces, various Caribbean islands. Results can be seen in these 4 maps.
It was a real pain in the ass to merge the spatial data to produce the maps!
Next up, we gathered cognitive ability data from international datasets, and various regional and subnational scholastic tests, and any other source of standardized testing we could find. These were then converted to British international norms (Greenwich mean IQ) as best we could. It gives this map.
Using data from across the world, we estimated the speed of selection against intelligence across countries.
There is a certain regionality to the data
Relatively atheistic north Europeans have apparently quite weak selection, while more religious areas have stronger negative selection. This is the opposite of what American data suggested when studying individuals.
There are 20 samples in Becker's collection from 12 studies. These produce a mean of about 75 IQ.
Some Indian nationalists attack some of these studies. One of them studied children with zinc deficiency. This was demmed unrepresentative. However, this is not true, as India at the time had about 30% of the population having a zinc deficiency. This is a typical mistake when looking at datasets from poor countries. Disease-free people are not representative in such countries, various deficiencies is the norm and should be included, not excluded.
In any case, the values from this study were about the same as the other studies.
Some big accounts as asking why so many MAGA types are suddenly so very anti-Indian, considering that Indians in the US and to some degree in the rest of the West, are model immigrants (high performance, low crime). The main answer is not difficult to understand.
This answer is based on the typical finding of sociology. In terms of partisanship, whichever groups in society you dislike is just the ones you perceive to be most different from you politically. Brandt and colleagues worked this out in 2014.
On top of this general pattern, there's the fact that importing a bunch of foreign workers depress local salaries. That is of course why the companies do this. What's the largest source of such foreigners? India. So capitalists love them (cheaper labor) and workers dislike them (suppress their wages).