#psychology #genomics #hbd #rstats #statistics #transhumanism #dataviz #openscience #psychometrics @OpenPsychJour
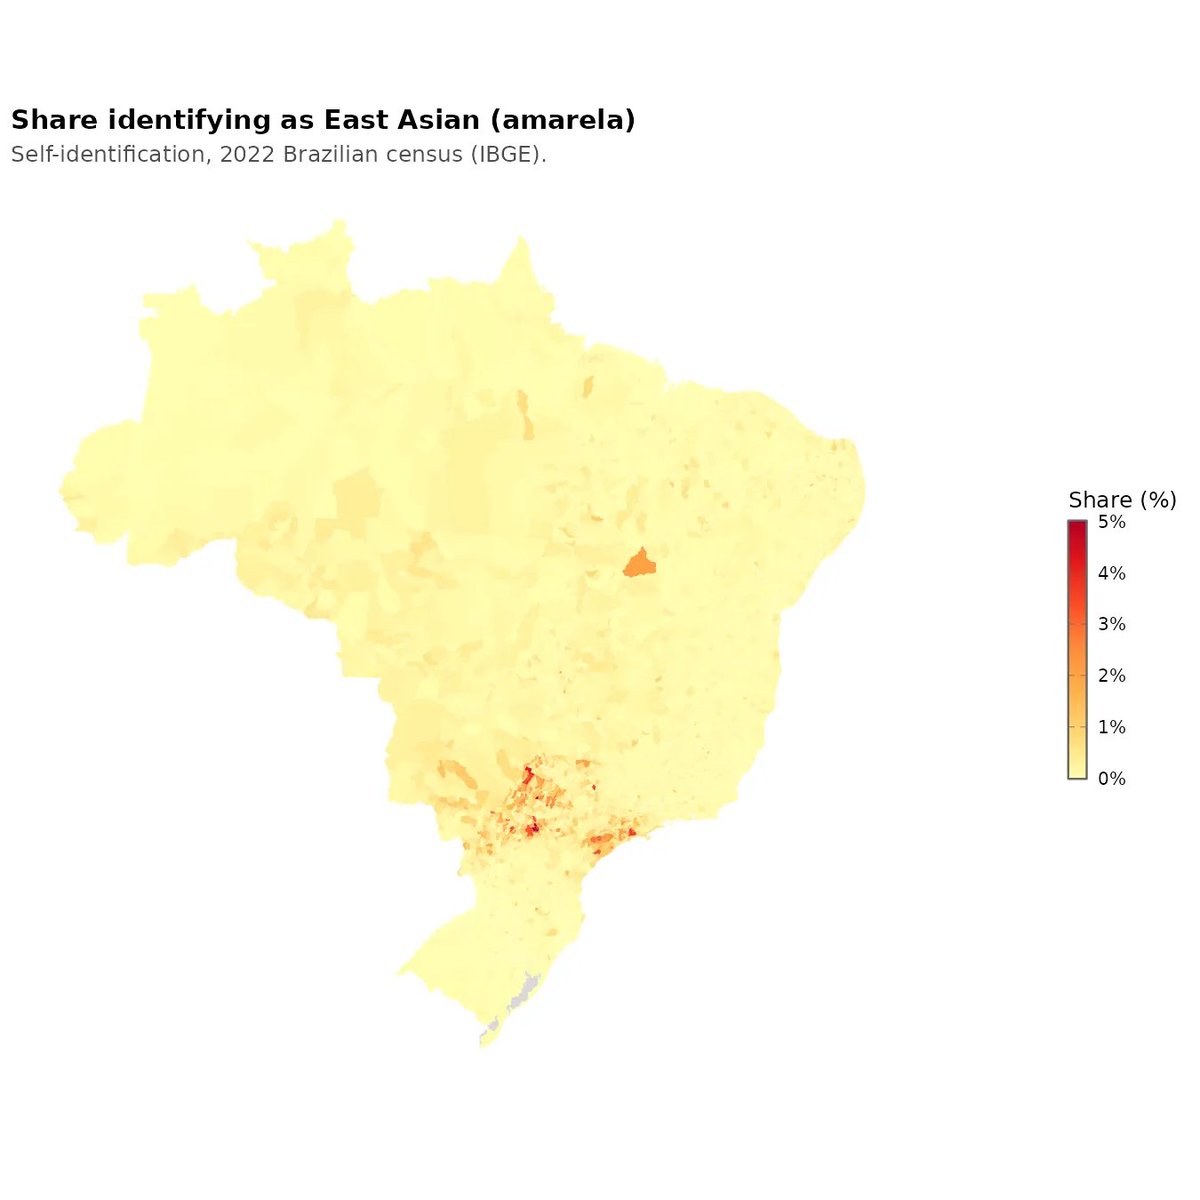
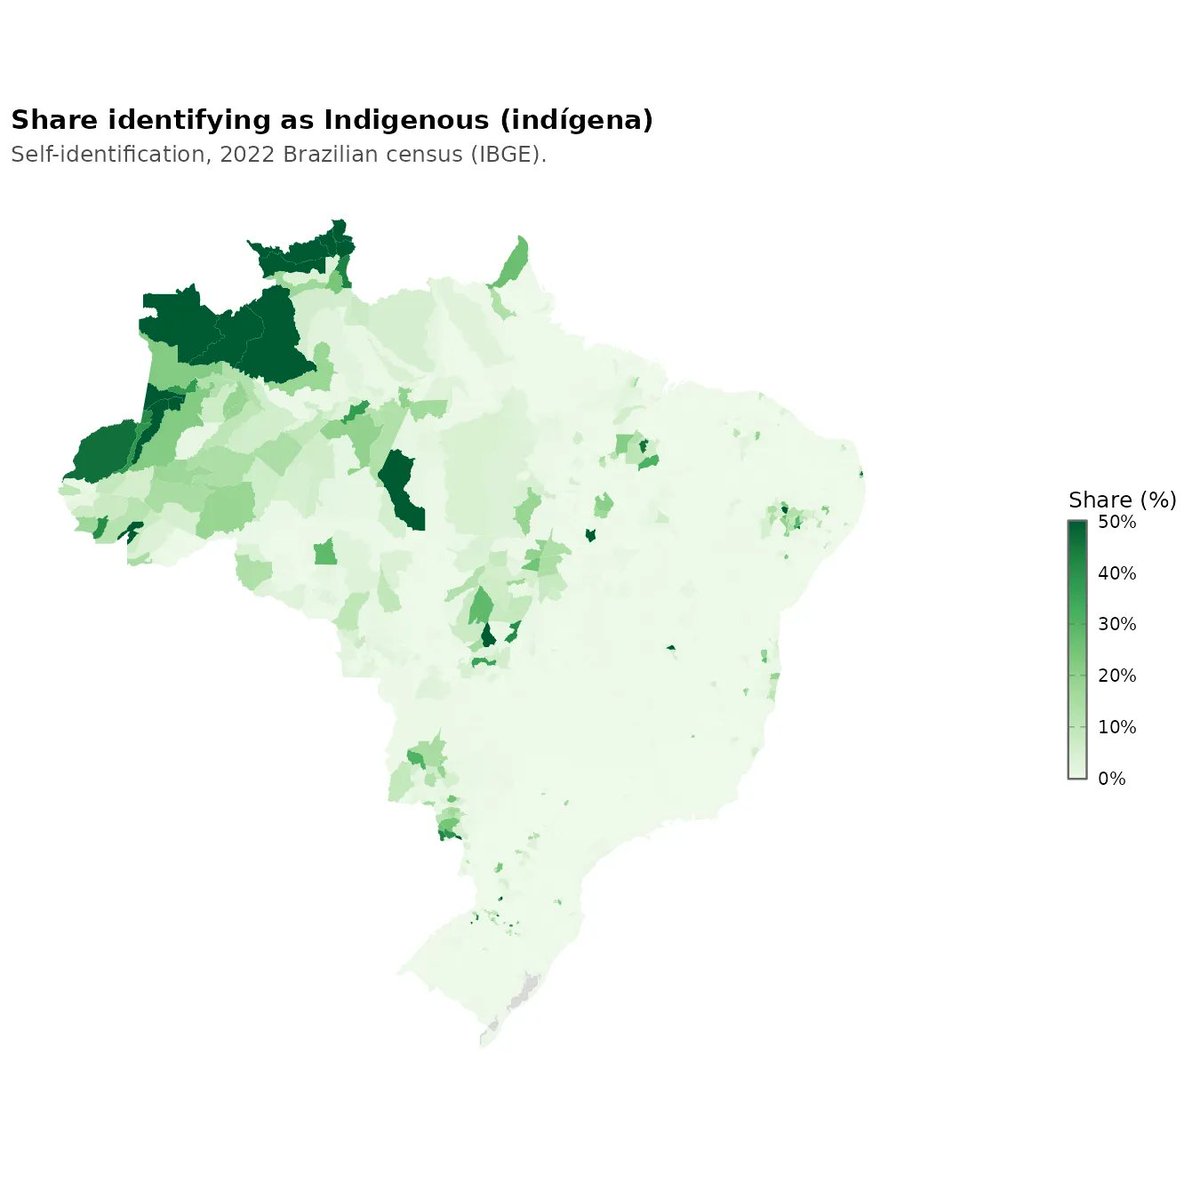
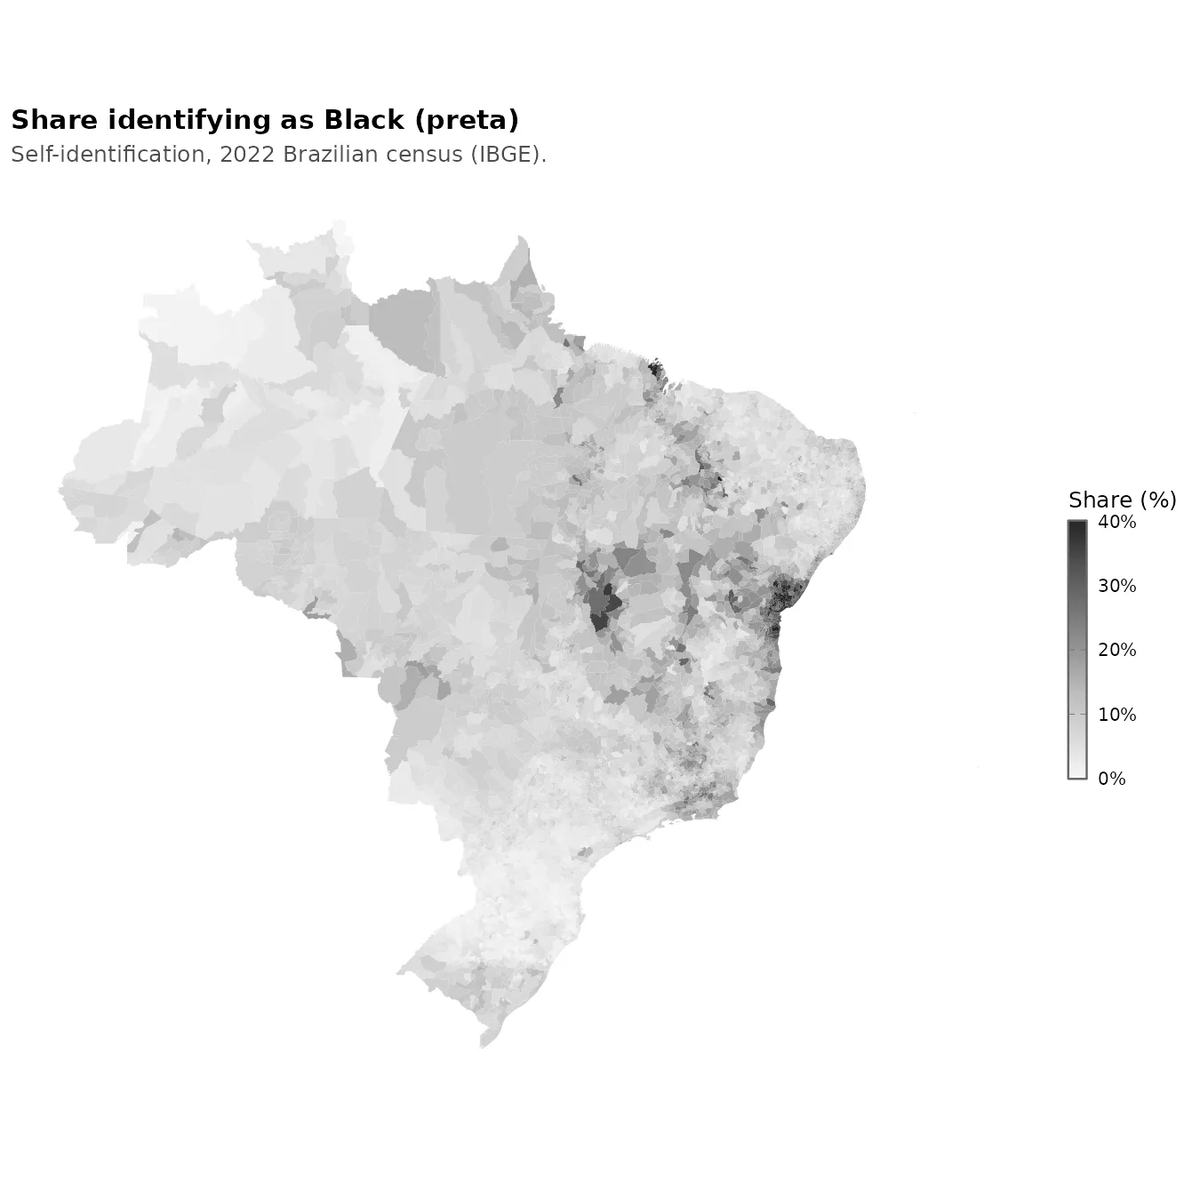
 Race proportions by municipality
 As elsewhere, the foreign born are clustered in cities.
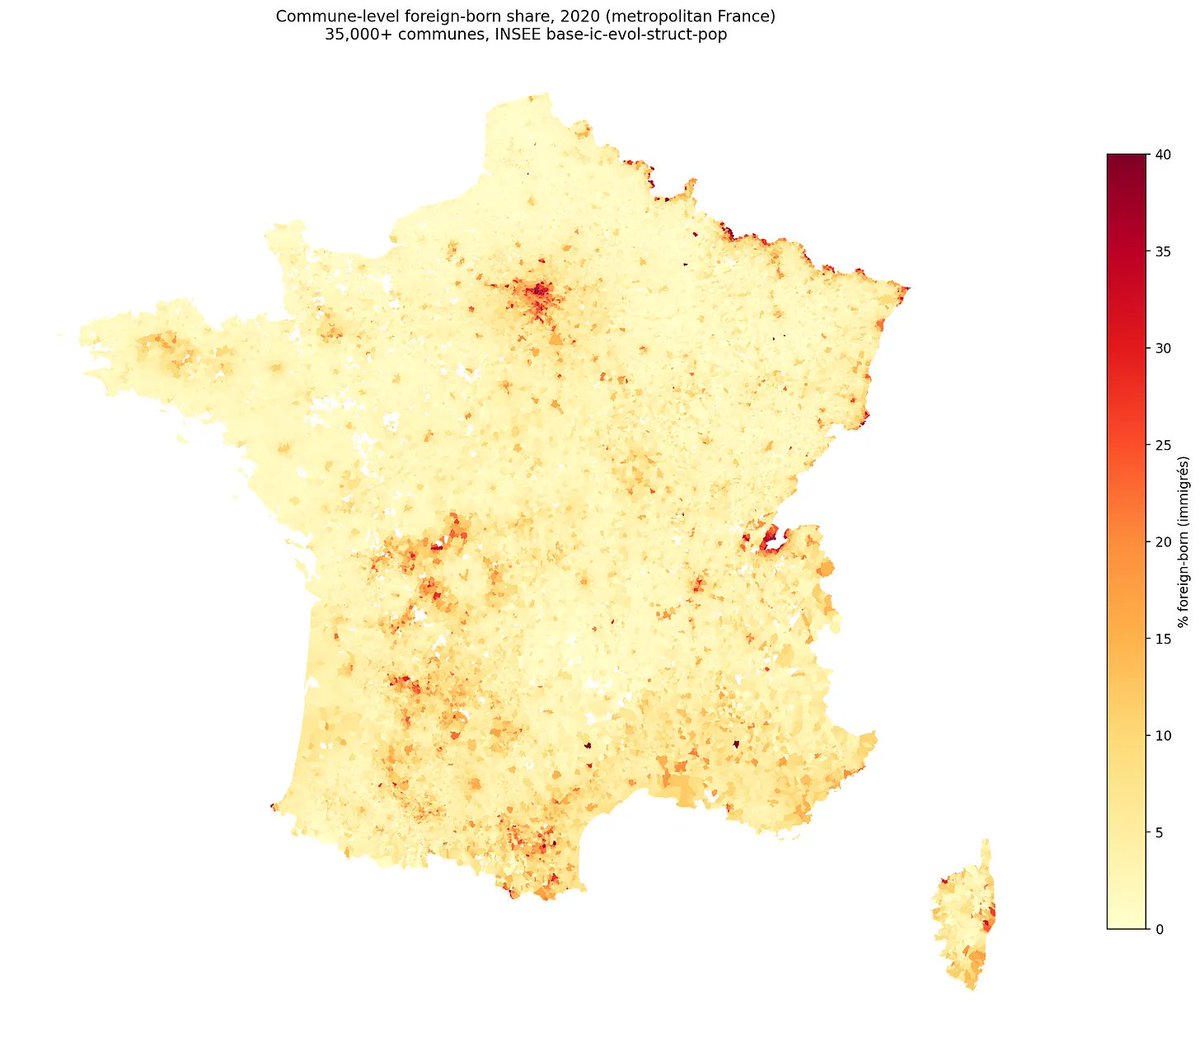
 However, looking at the world at large for the same period (2000-present), the picture is not so clear. R2 dropped from 52% to 9%. Looking at the plot, most of the dots that didn't grow as expected are Africans. It's another example of OECD fallacy, one can get substantially wrong ideas about how the world works by only looking at a subset of mostly European, above average countries.
 Case summaries. Many of them are quite funny.
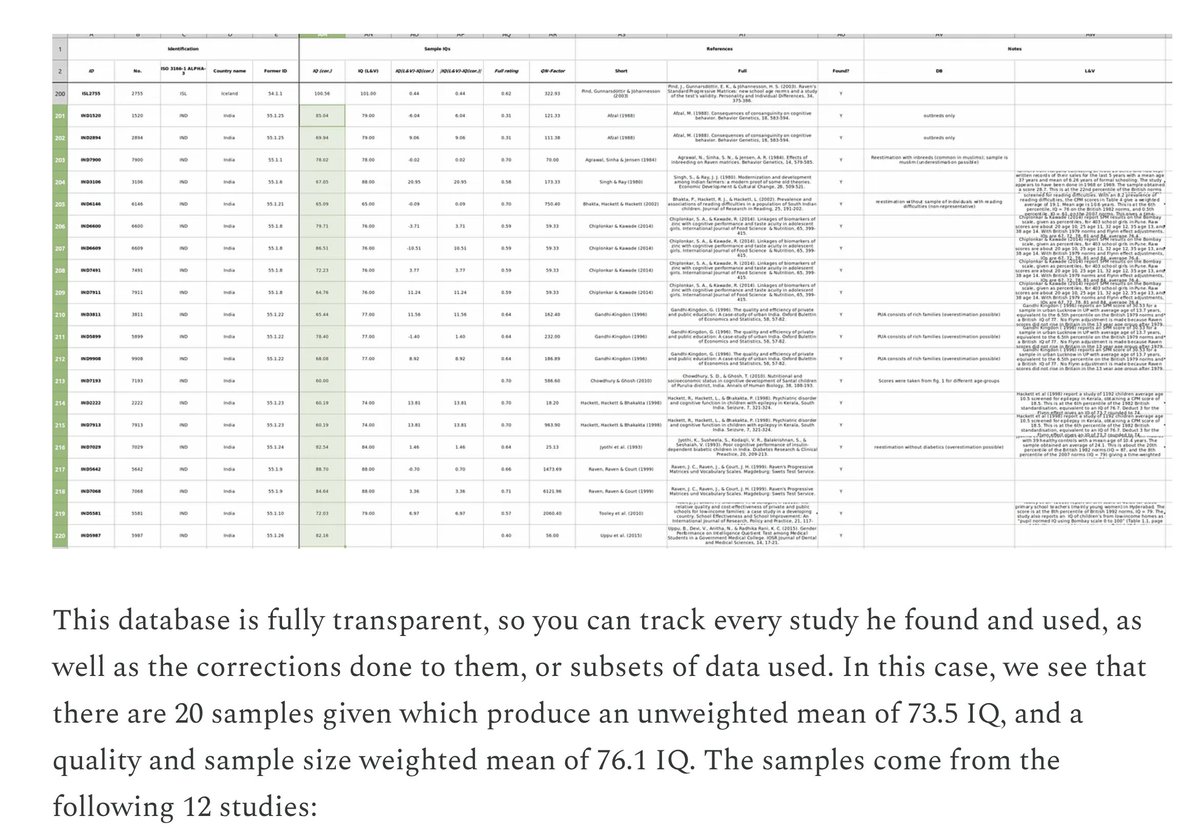
 First, there appears to be reverse publication bias for Black IQs, smaller studies find _larger_ values. This is a prediction from leftism bias model, since social scientists hack in the preferred direction, which is usually positive, but sometimes negative. Adjusting for this gives a Black IQ estimate 82 instead of 85.
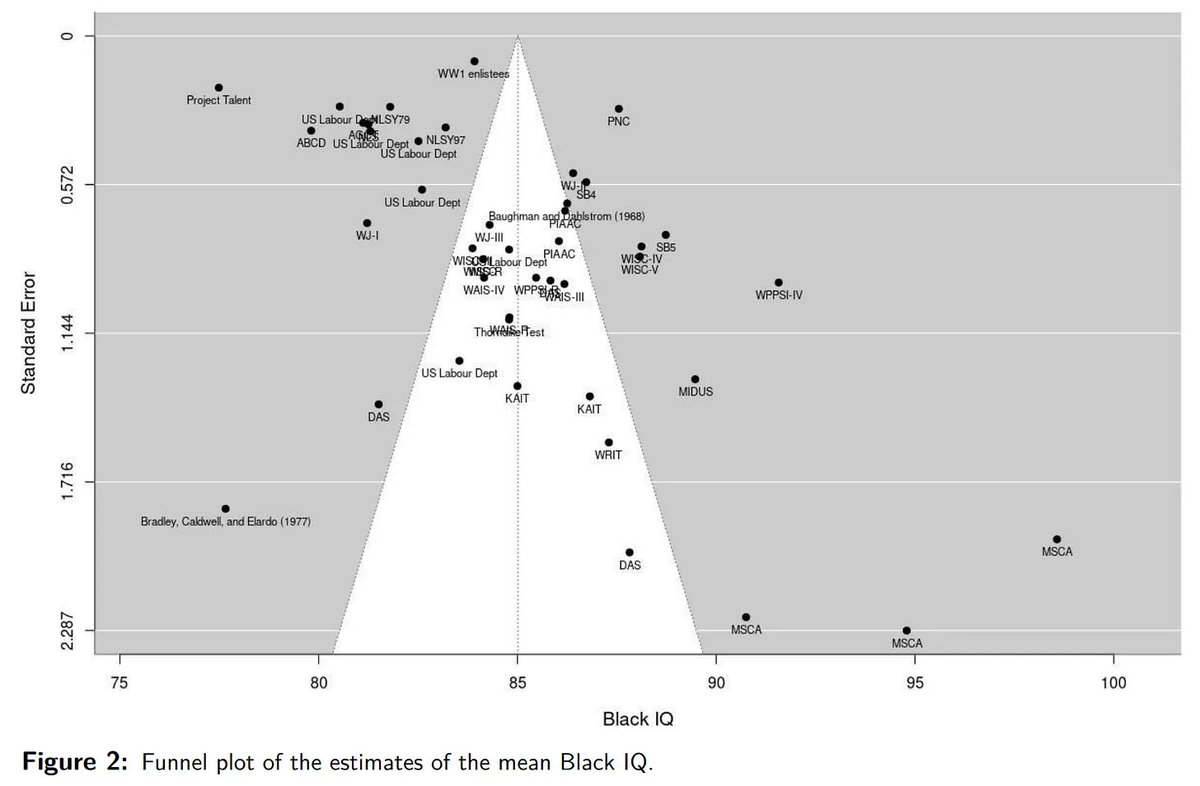

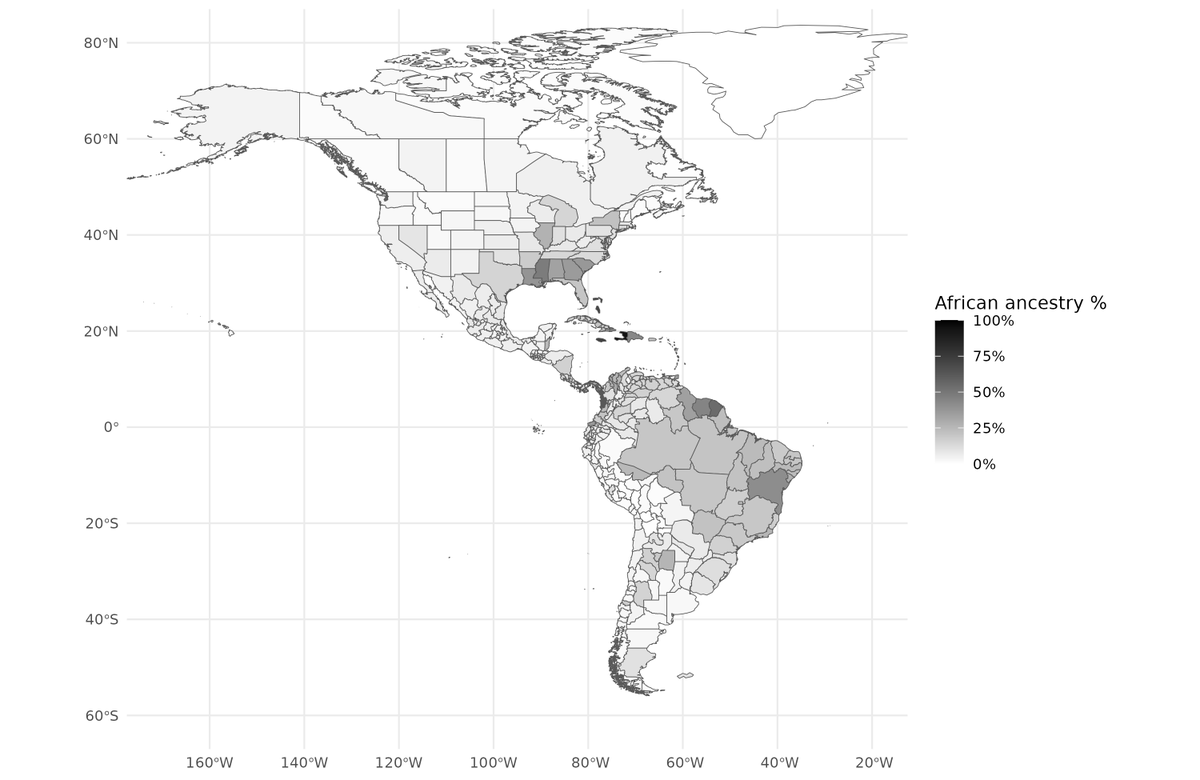
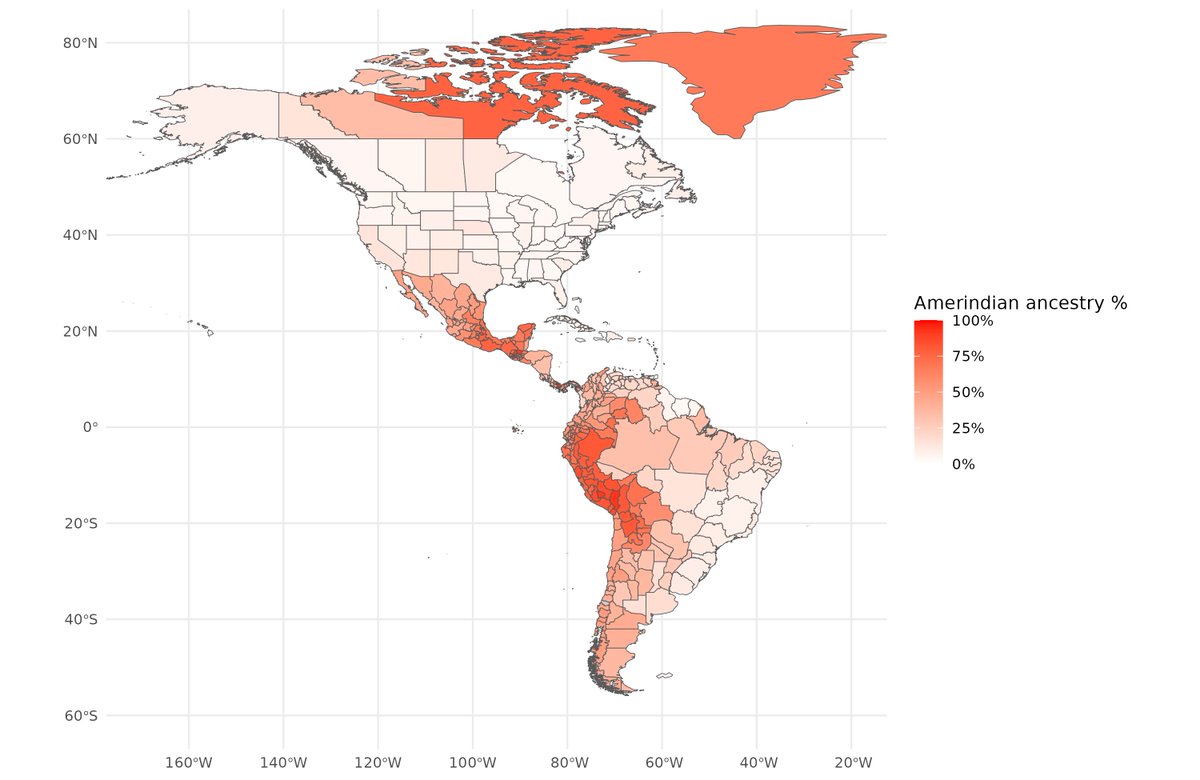
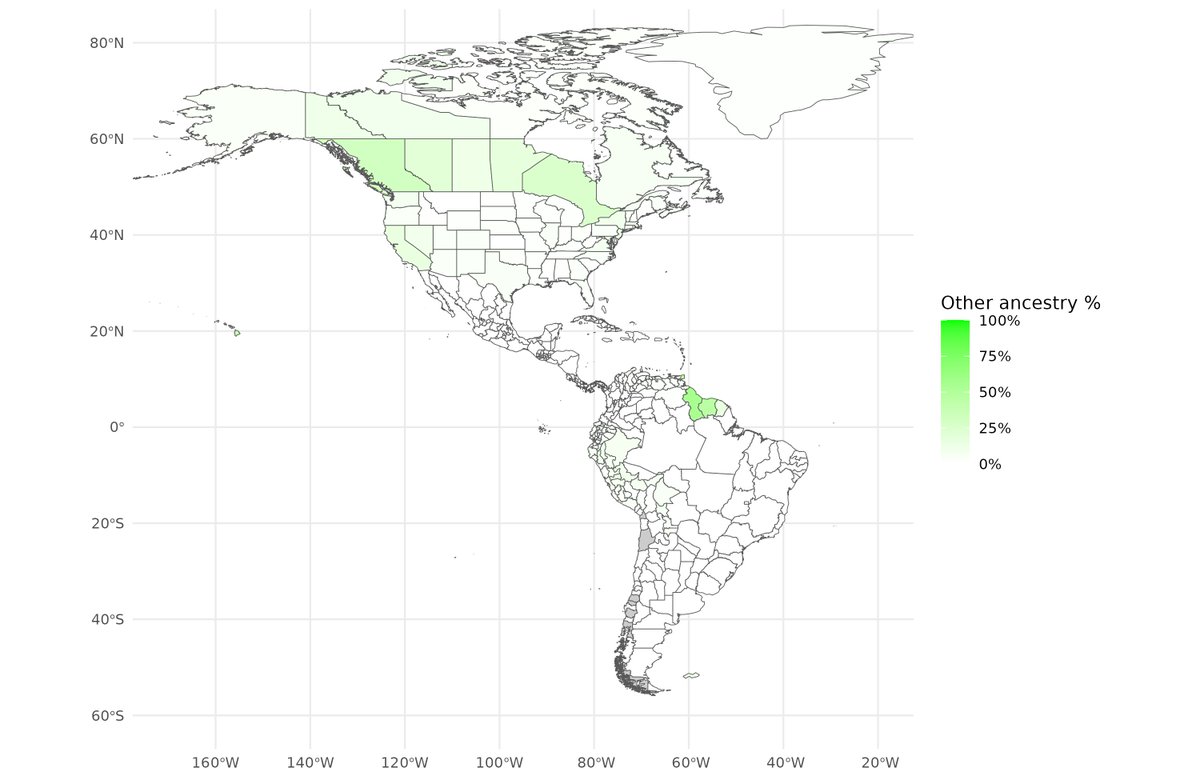
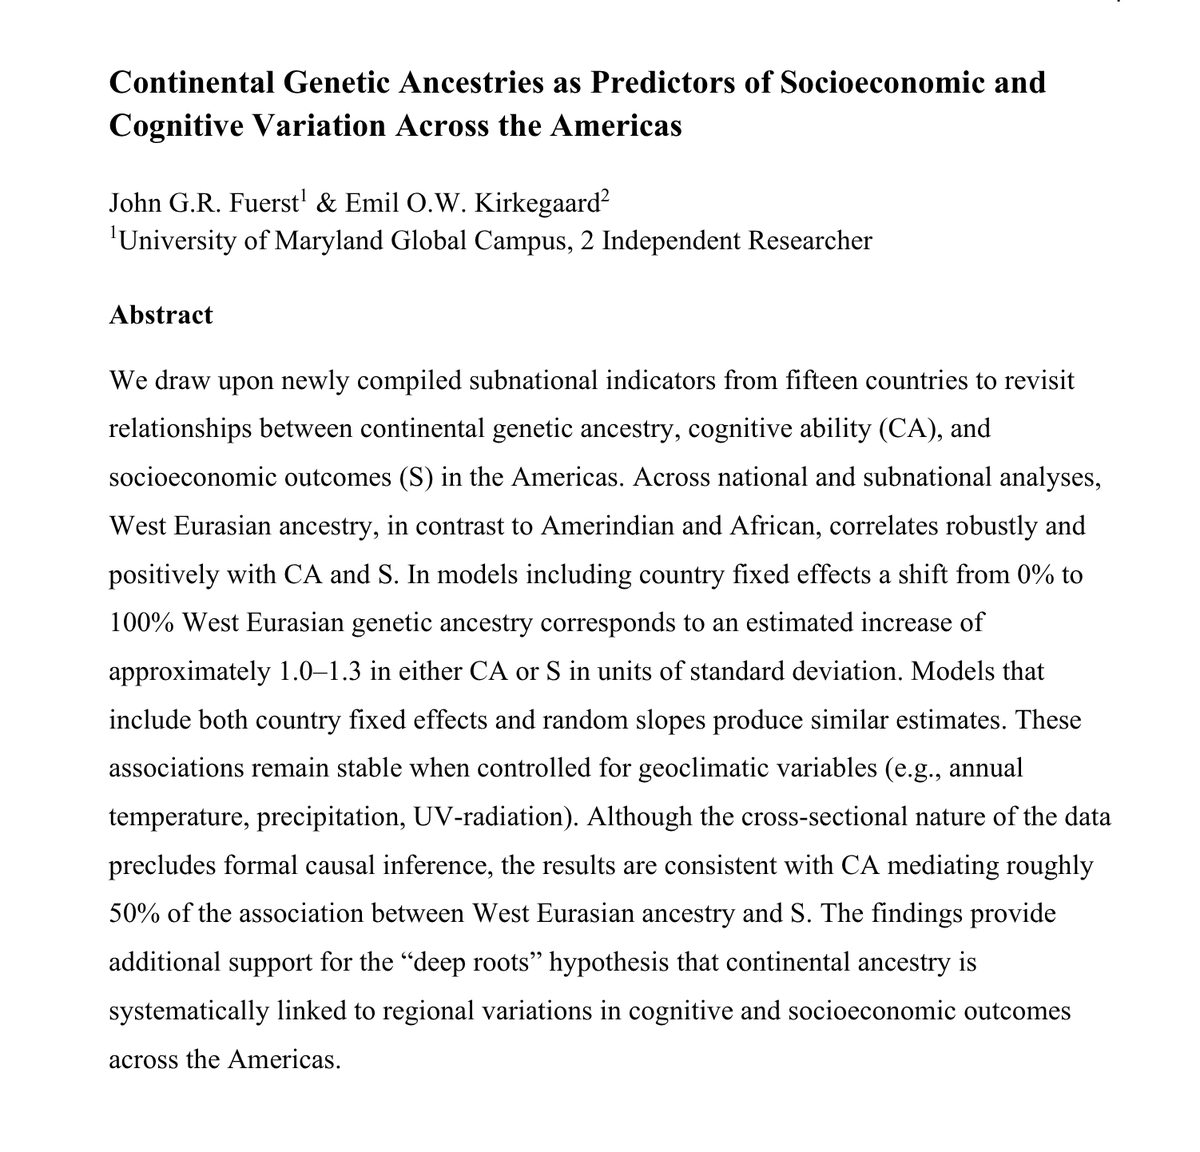 First, we compiled data from 100s of sources to estimate genetic ancestry for over 400 units in the Americas. These are countries and subnational divisions of the larger countries, such as US states, Canadian provinces, various Caribbean islands. Results can be seen in these 4 maps.
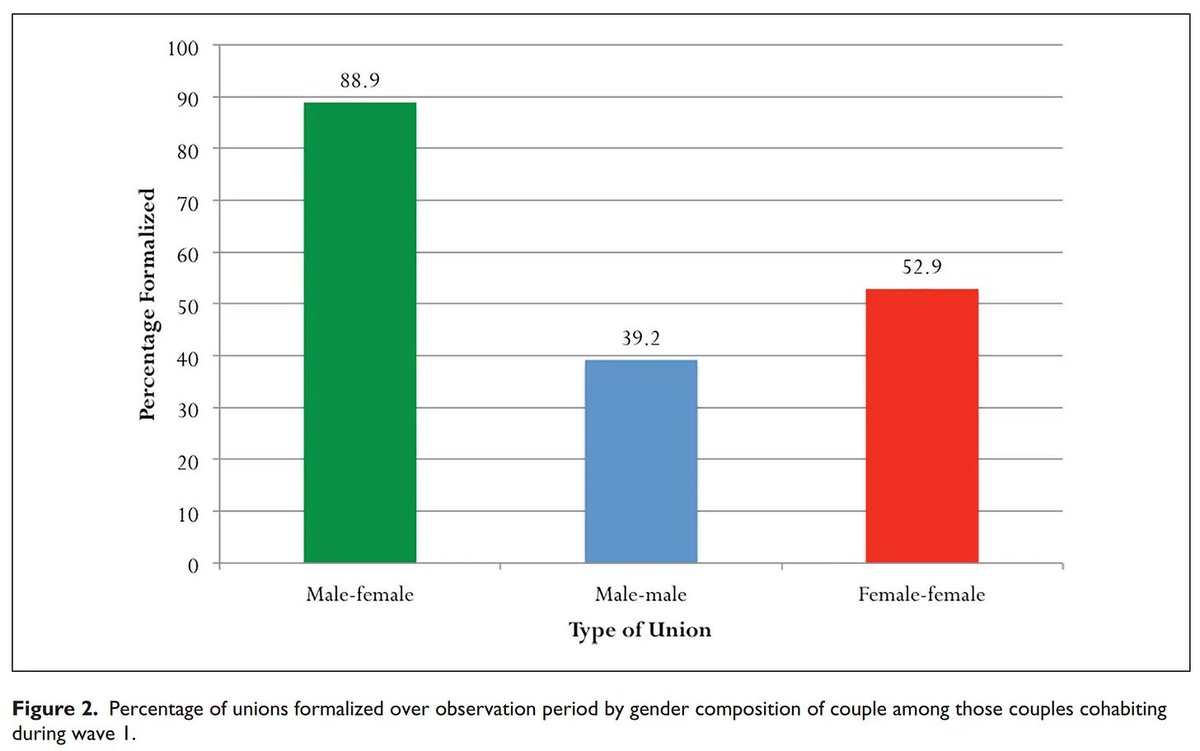
 This is the original figure from the study. This shows us that formal unions are much more stable, not so surprisingly. Note the lack of error bars.
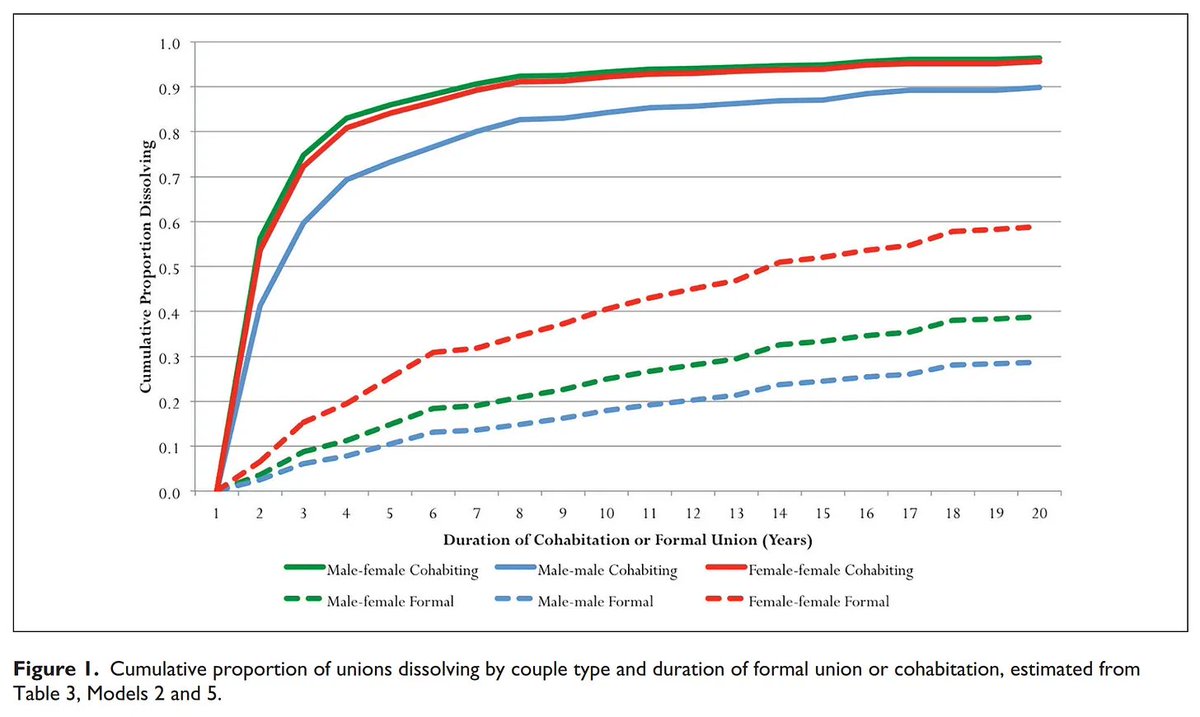
 There is a certain regionality to the data

 This answer is based on the typical finding of sociology. In terms of partisanship, whichever groups in society you dislike is just the ones you perceive to be most different from you politically. Brandt and colleagues worked this out in 2014.
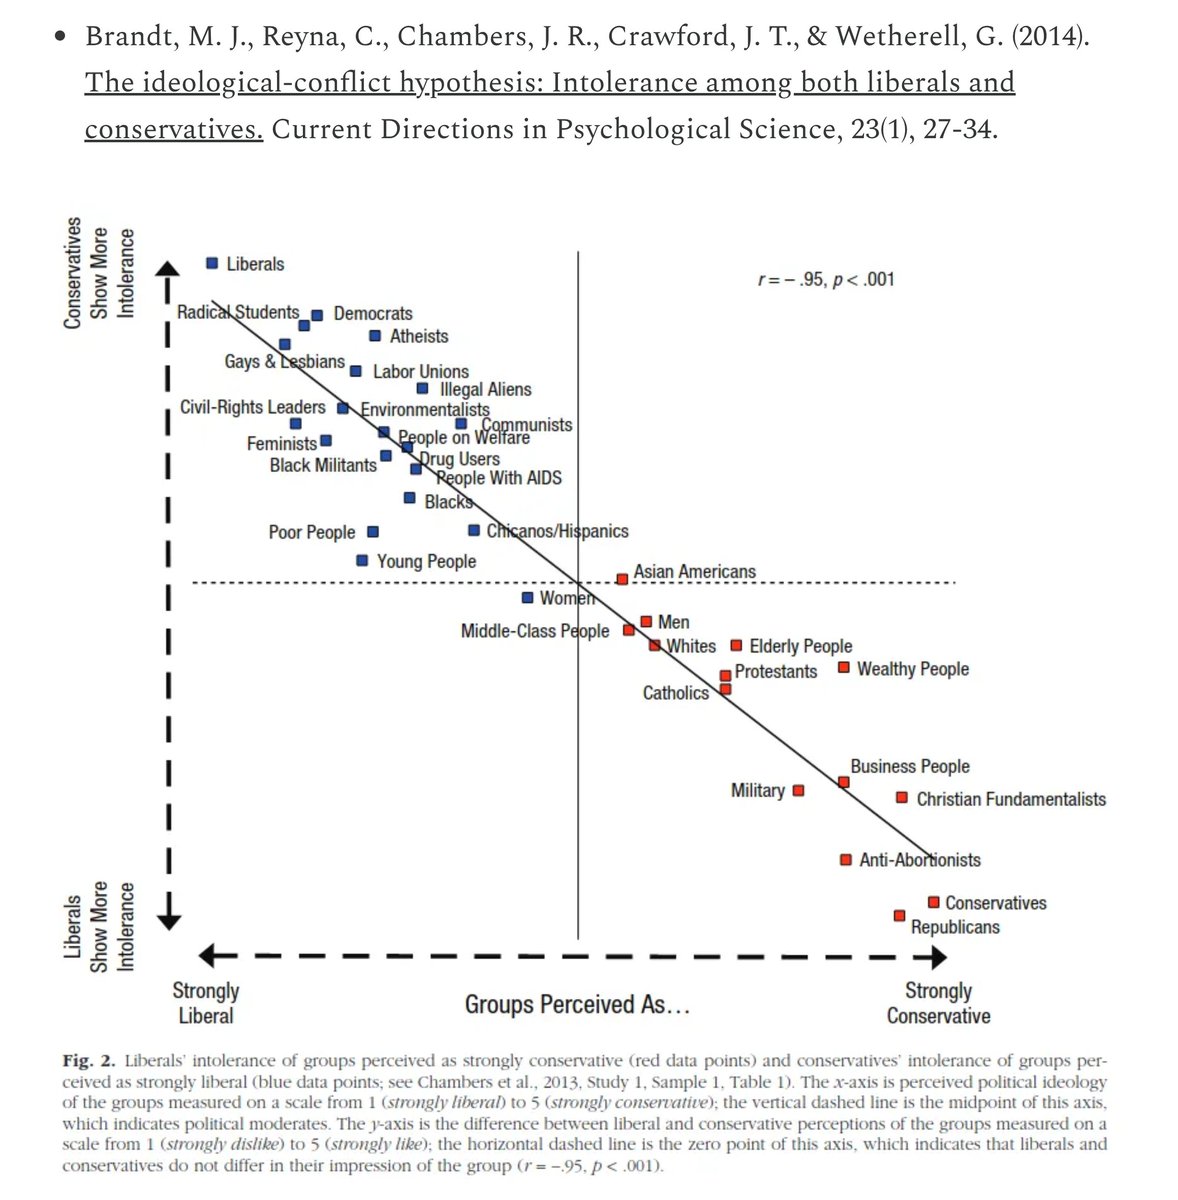
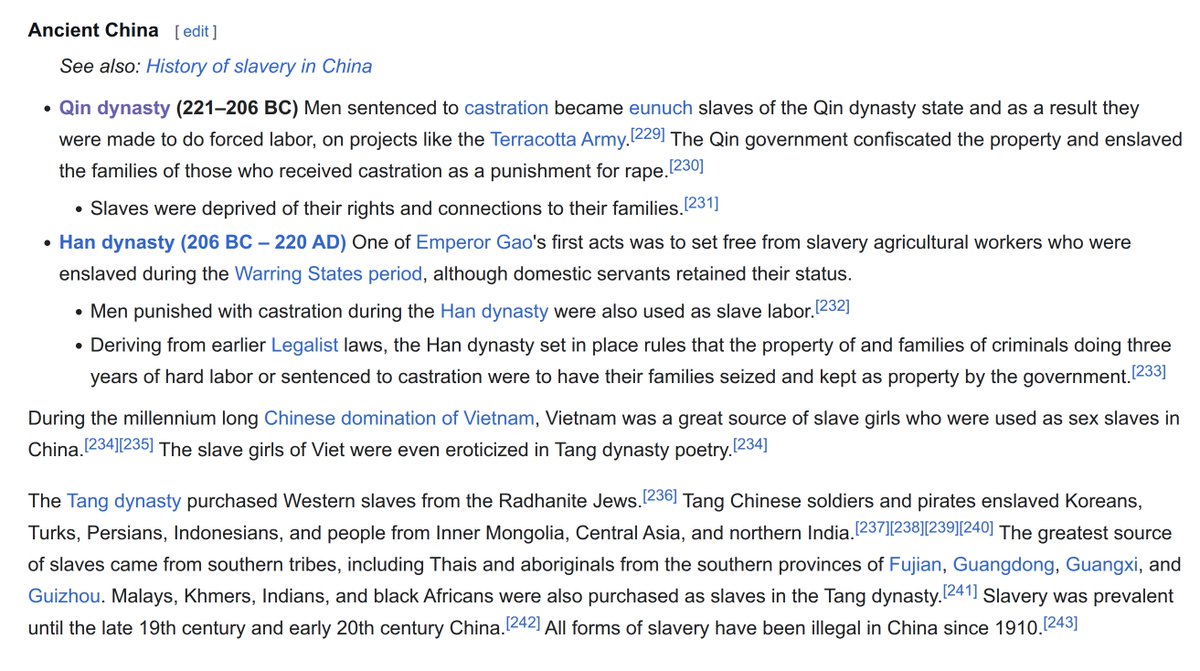
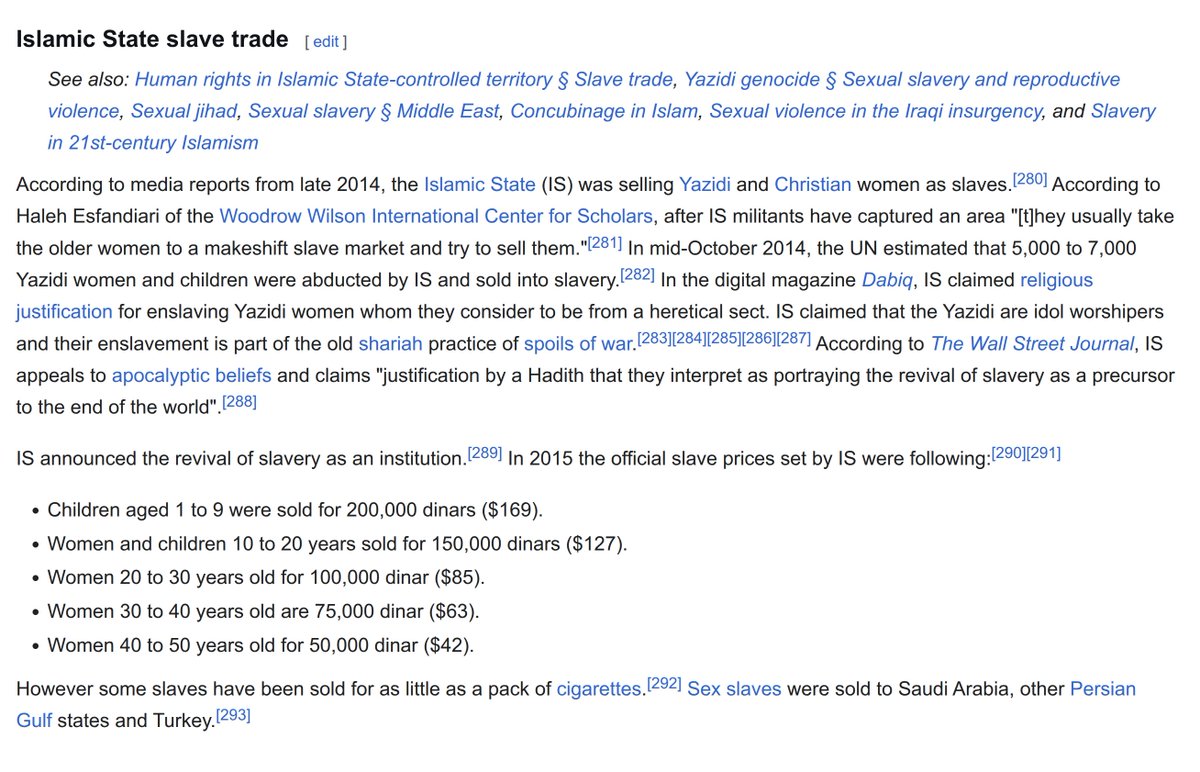
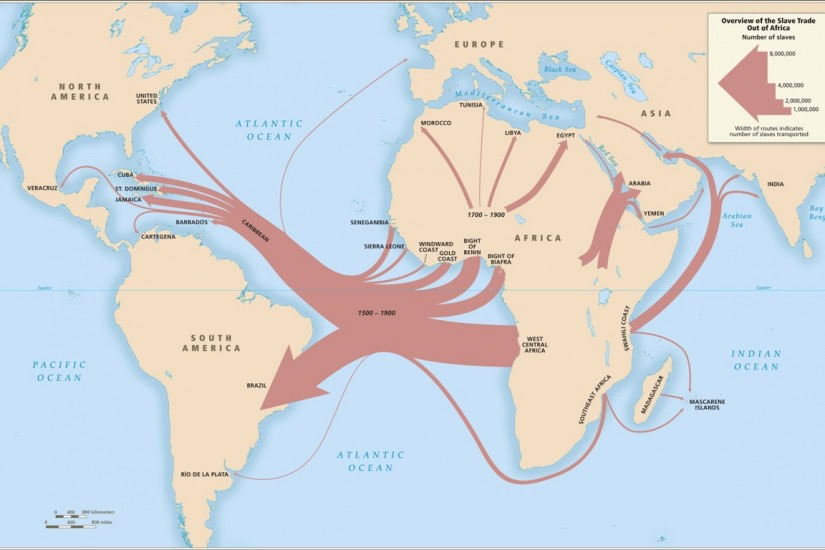 However, slavery was more or less a human universal. Pre-Columbian Americas, ancient China, or the Islamic world.
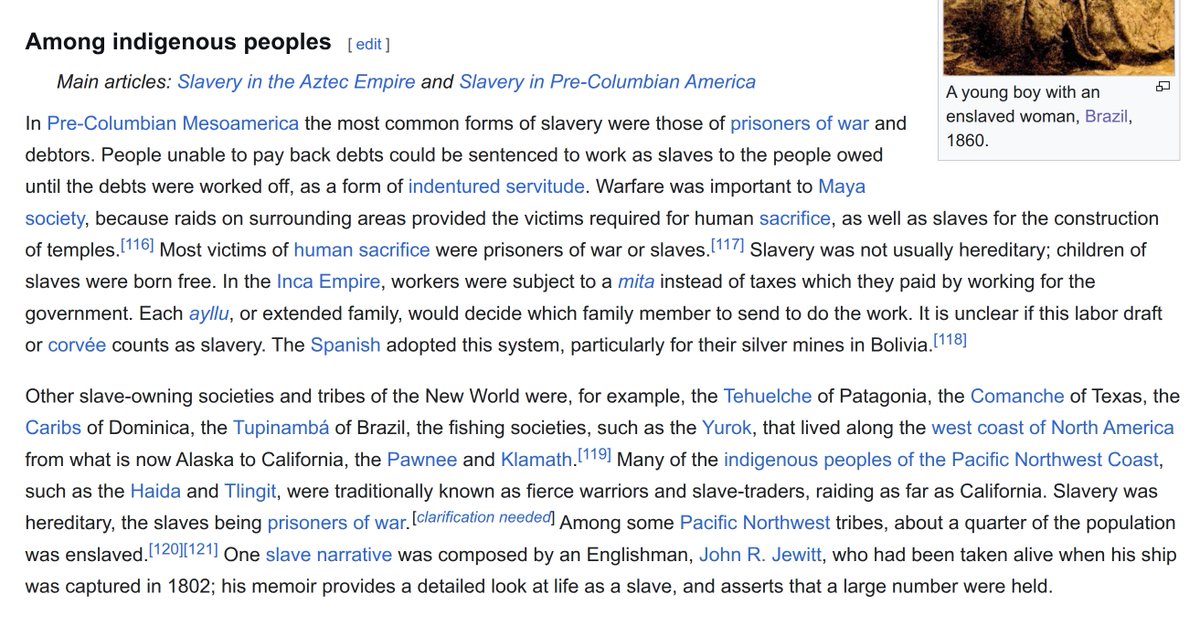
 archive.org/details/worlds…
 Inbreeding is strong. The median person had identical blocks in their genome at the level suggesting their parents were 3rd cousins, whereas the human average is about close to 4th cousins (Africans less).
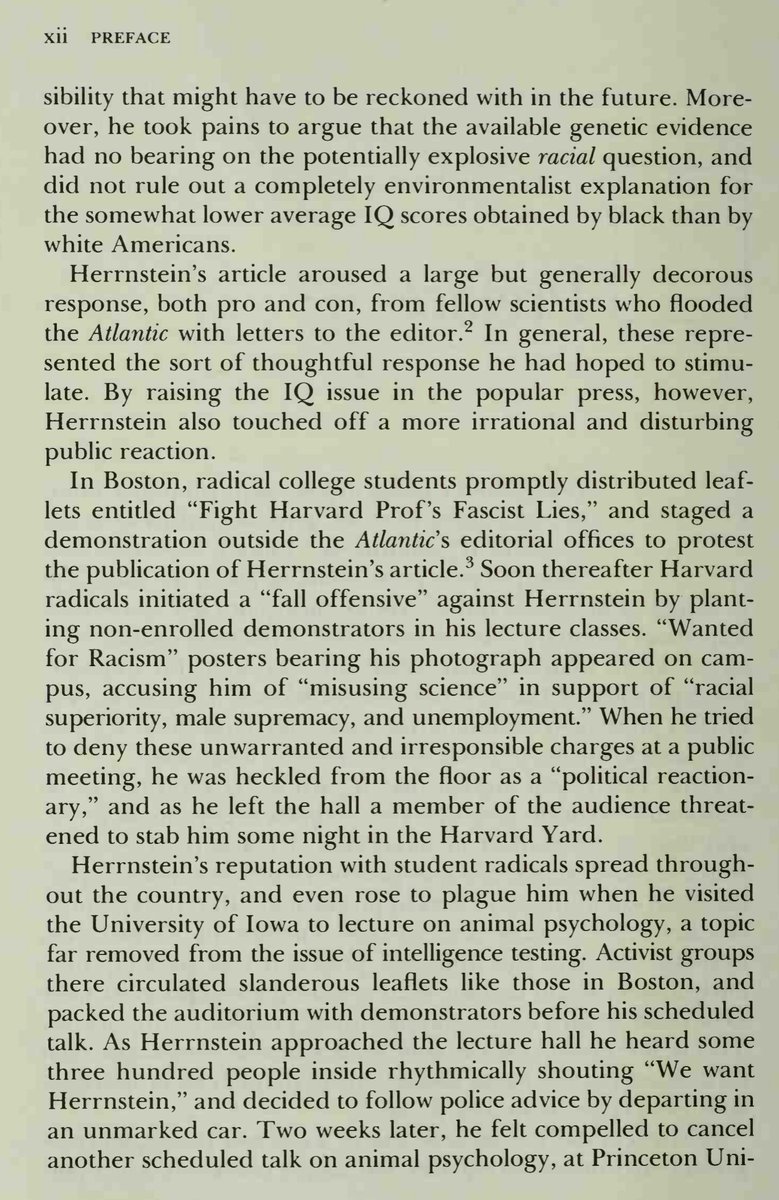 From The Intelligence Men: Makers of the I.Q. Controversy, Raymond E. Fancher, 1985
 We can also look at the top list of most fraudulent researchers ever (so far those that were caught). Note: data from 2019 list. There's quite a few non-Europeans.
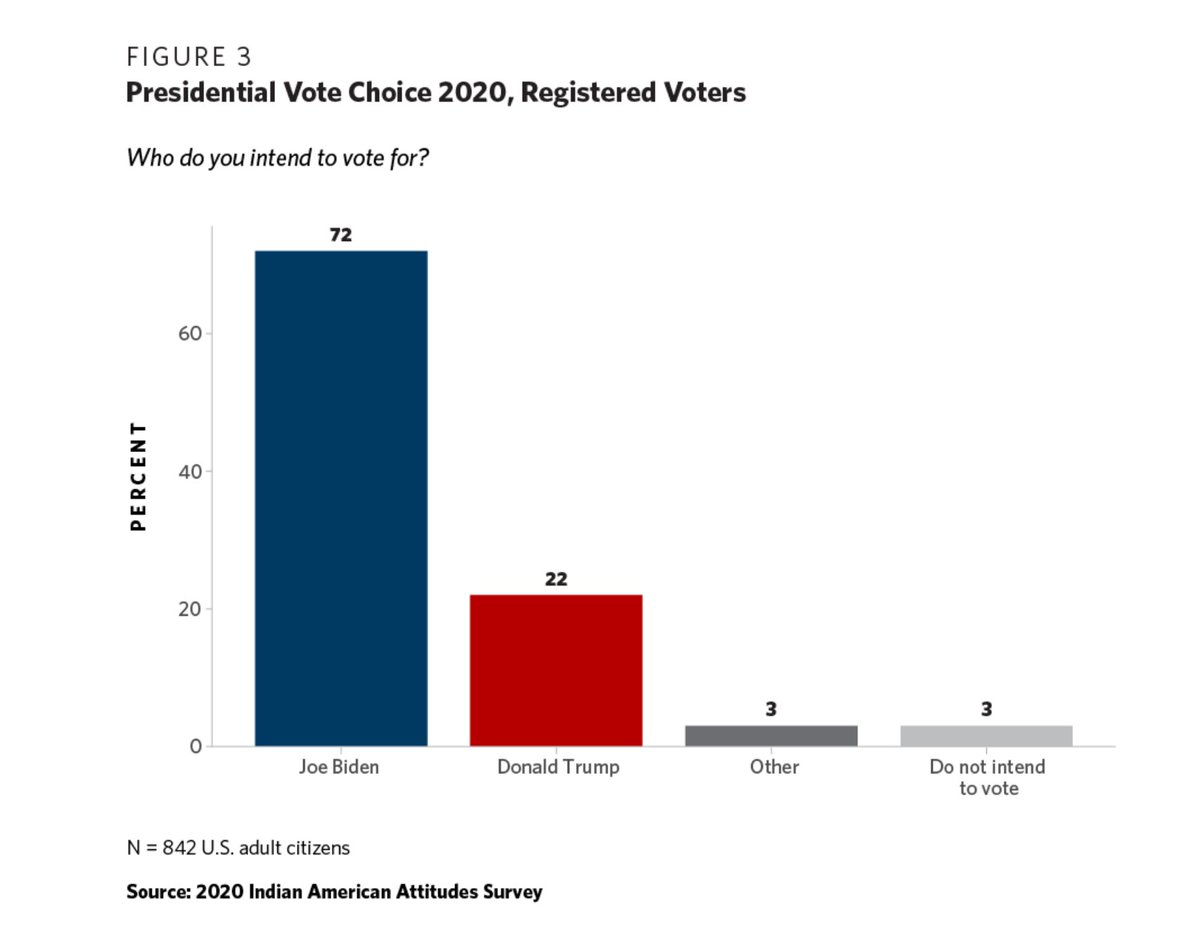
 Since it only covered a single year, 2020, I wondered if this would replicate across years of data. So I downloaded the data for 1964-2024.
 The motivating factors behind this approach compared to the categorical (diagnostic) approach are: 1) evidence of continuity between clusters, 2) binary encoding of continuous data loses information, 3) correlations among diagnoses are the norm, 4) a given person may not quality for any particular diagnosis, yet have severe symptoms.
 First ratings were adjusted for small sample bias using empirical Bayes
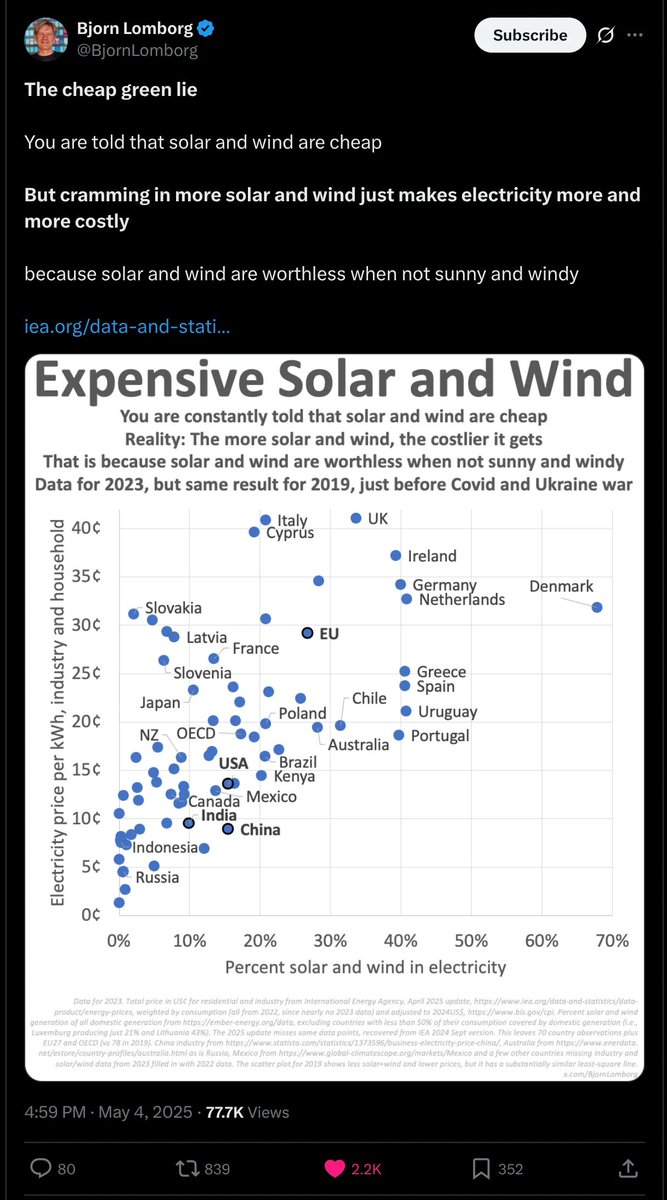 I downloaded data for 130+ countries, an these are the distributions of renewables for the rich world countries. Denmark is unfortunately number 1 for wind power.
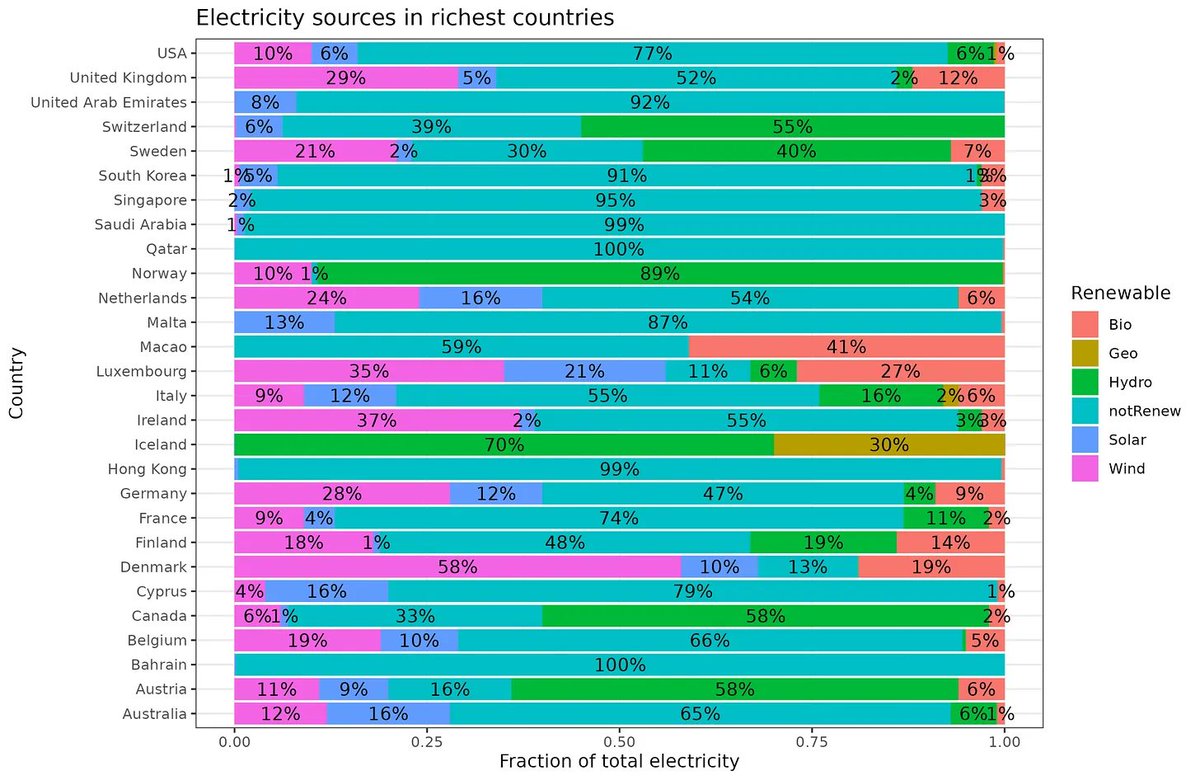
 You may be able to see that the pattern is quite nonlinear, and a spline test confirms this.