🧵New normalization paper
Franzke, C. L. (2021). Towards the development of economic damage functions for weather and climate extremes. Ecological Economics, 189, 107172.
doi.org/10.1016/j.ecol…
Comprehensively validates (again) the normalization literature
Short thread...
Franzke, C. L. (2021). Towards the development of economic damage functions for weather and climate extremes. Ecological Economics, 189, 107172.
doi.org/10.1016/j.ecol…
Comprehensively validates (again) the normalization literature
Short thread...
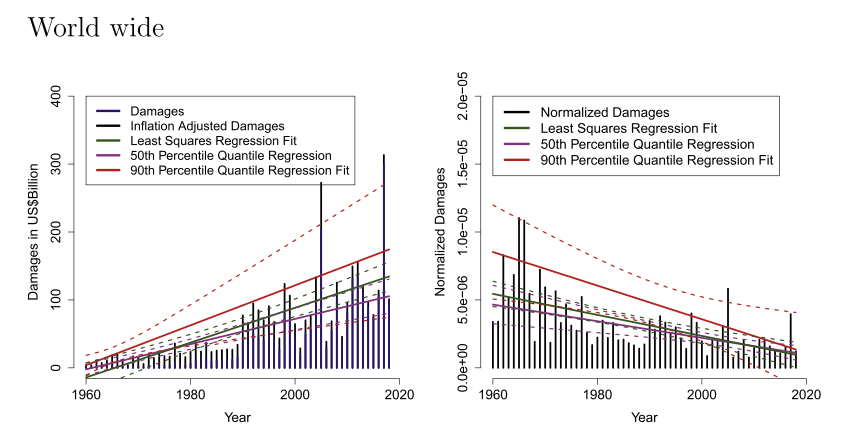
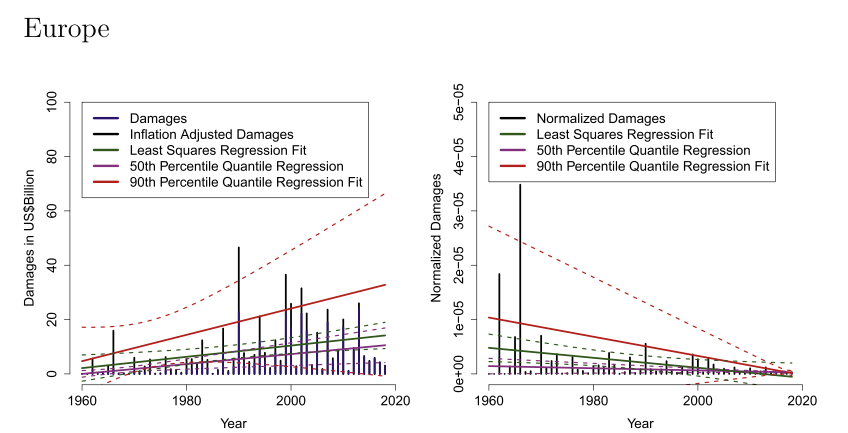
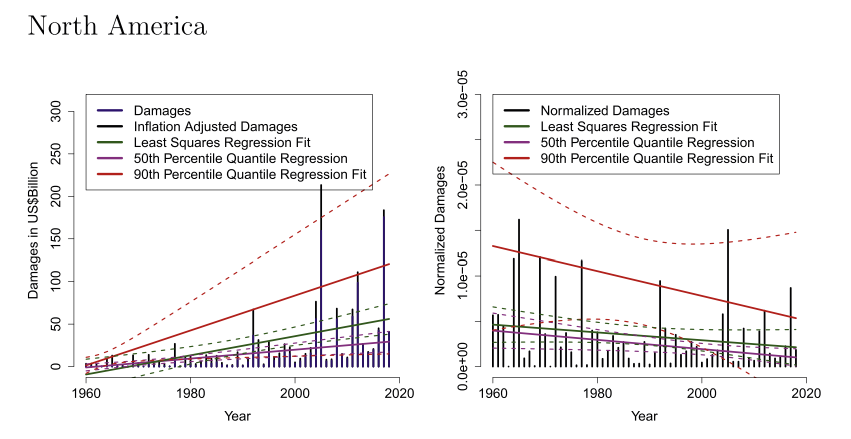
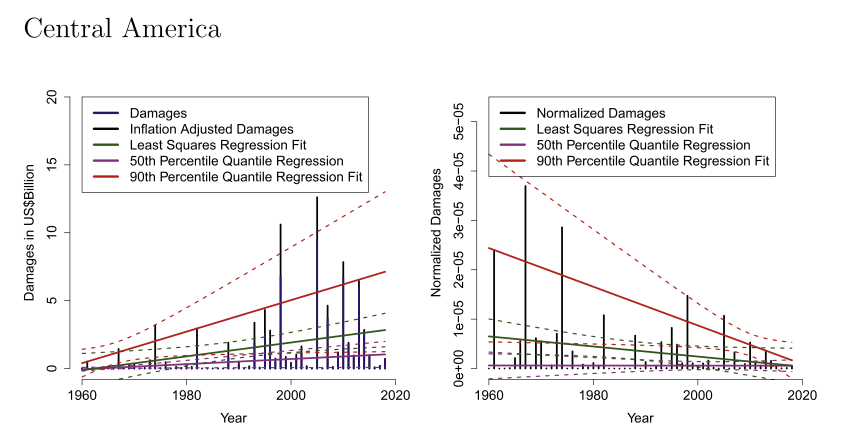
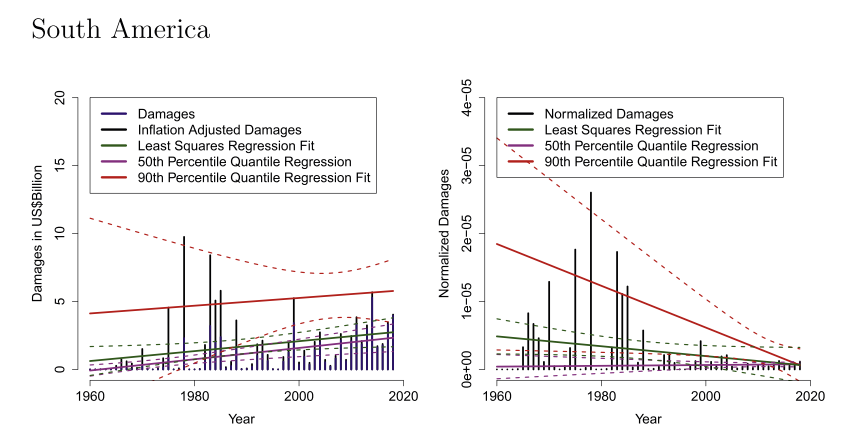
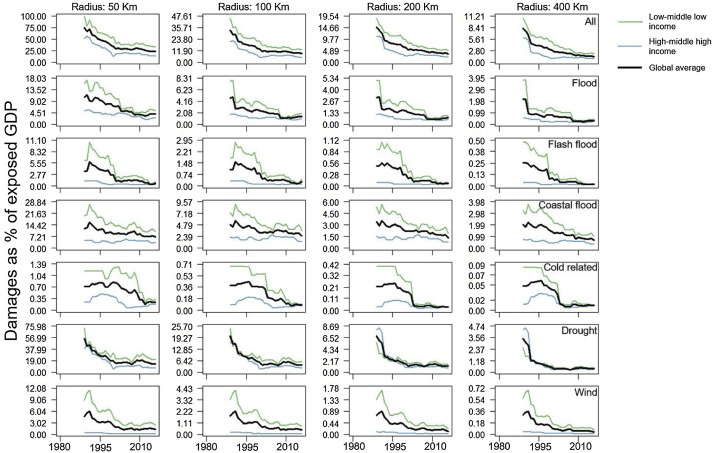
Economic damage from weather extremes has increased around the world as wealth & exposure have grown
But normalized for GDP, damage is down sharply
This is great news
But normalized for GDP, damage is down sharply
This is great news
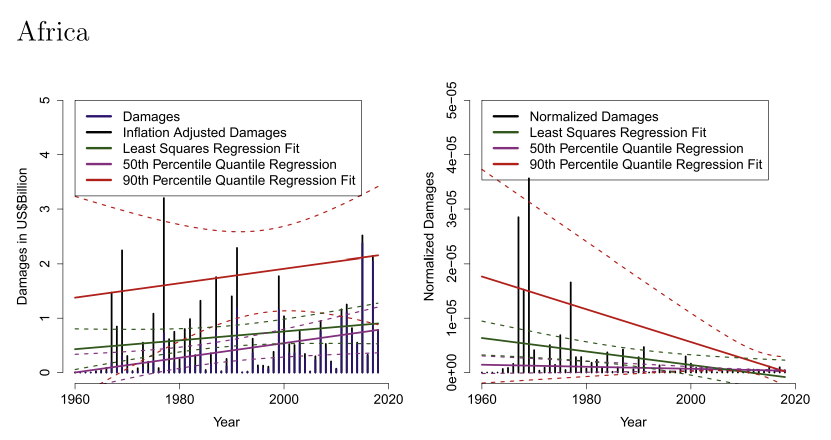
This trend holds in Africa
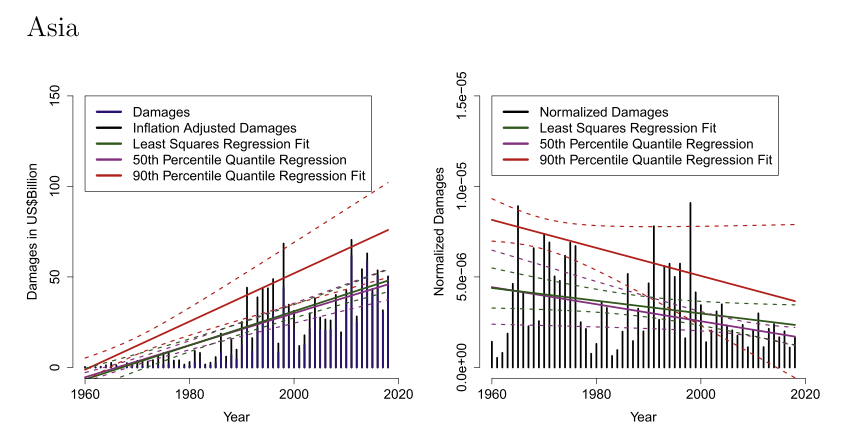
This trend holds in Asia
This trend holds in Europe
This trend holds in North America
This trend holds in Central America
This trend holds in South America
This trend holds in Oceania
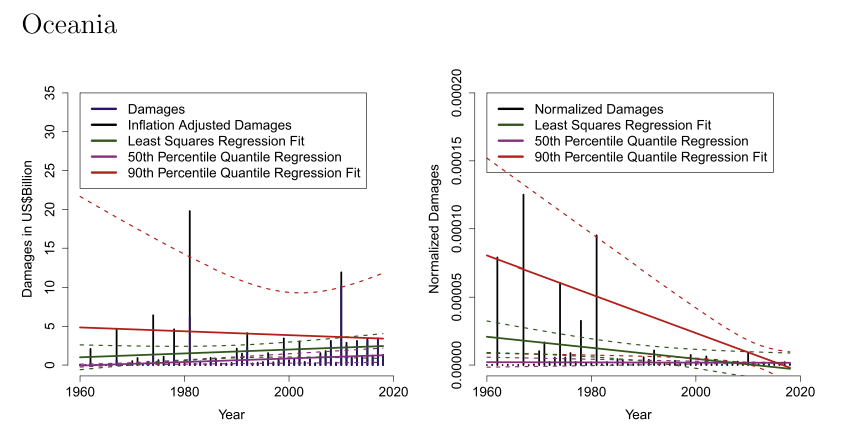
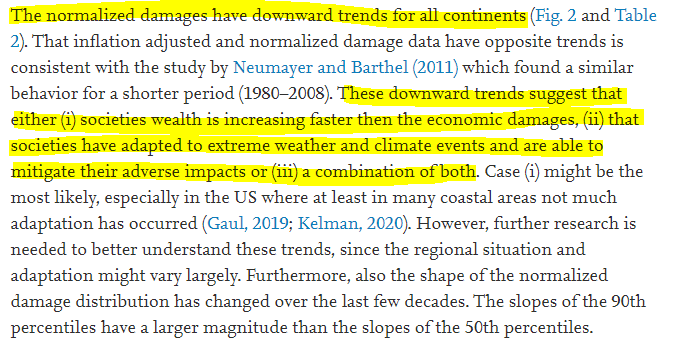
The paper concludes
"normalized damages have downward trends for all continents"
Why?
Wealth growing faster than damage
& improved adaptation to weather/climate
"normalized damages have downward trends for all continents"
Why?
Wealth growing faster than damage
& improved adaptation to weather/climate
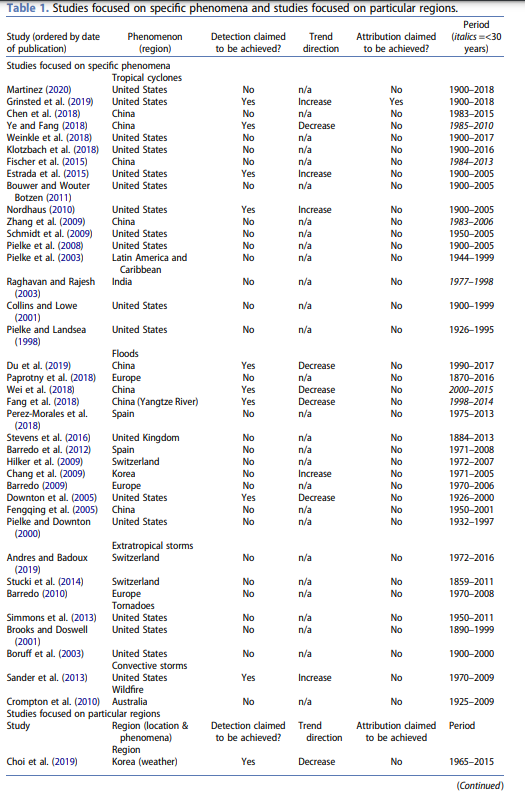
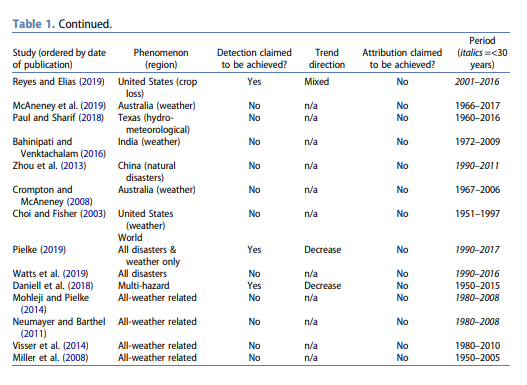
The analysis is fully consistent with my recent review of normalization studies
Pielke, R. (2021). Economic ‘normalisation’ of disaster losses 1998–2020: a literature review and assessment. Environmental Hazards, 20(2), 93-111.
doi.org/10.1080/174778…
Pielke, R. (2021). Economic ‘normalisation’ of disaster losses 1998–2020: a literature review and assessment. Environmental Hazards, 20(2), 93-111.
doi.org/10.1080/174778…
I reviewed 54 normalization studies, most at the regional level and for specific phenomena & found little evidence for increasing normalized losses anywhere
This is great news!
This is great news!
Combine these analyses with evidence of decreasing vulnerability worldwide & across phenomena
Formetta, G., & Feyen, L. (2019). Empirical evidence of declining global vulnerability to climate-related hazards. Global Environmental Change, 57, 101920.
doi.org/10.1016/j.gloe…
Formetta, G., & Feyen, L. (2019). Empirical evidence of declining global vulnerability to climate-related hazards. Global Environmental Change, 57, 101920.
doi.org/10.1016/j.gloe…
FF2019 show that the world has become comprehensively less vulnerable to weather and climate extremes ... it is not a close call or dependent upon tricky methods
This is great news!
This is great news!
Study after study report findings completely at odds with media, policy & celebrity scientists discussions of weather and climate extremes
I do wonder how long this huge gap between evidence & spin can last ... it's already lasted way longer than I'd have guessed!
Now you know
I do wonder how long this huge gap between evidence & spin can last ... it's already lasted way longer than I'd have guessed!
Now you know
• • •
Missing some Tweet in this thread? You can try to
force a refresh