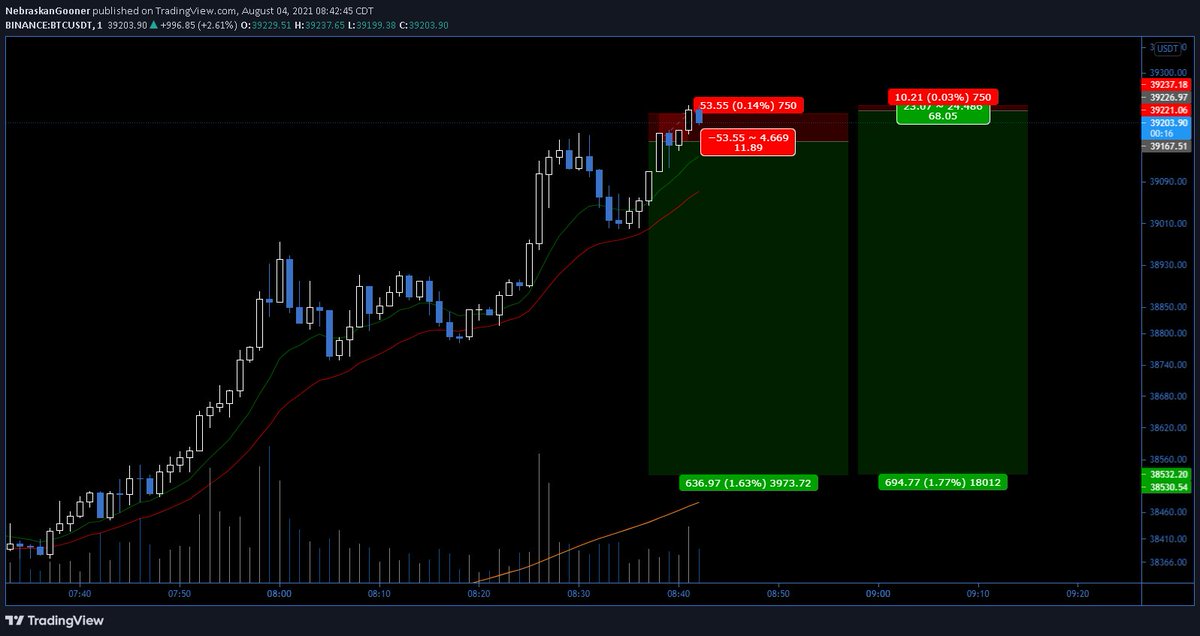
Went against my own rule & got stopped out on this 1m scalp
Rather than waiting for a 1m close above invalidation I just closed manually as I wasn't going to get stuck in a big green candle if we popped through resistance
When scalping it's all about small losses and killer R:R
Of course I'd never FOMO back in late.
I just wait for my next killer R:R opportunity and have a go.
And then I can add a second position with even less risk and my 1st trade is still valid.
But I'll never fight over and over and over so if stopped here I would be done going against the grain.
Now second position stop loss goes to break even.
First position can get tightened. Soon I can take profit on 2nd entry which will cover any losses incurred by first entry.
First stop at entry, second stop in profit.
2nd position TP'd fully at 40%.
Risk free scalp now on the 1st entry with stop loss at break even. WIll shave profit on that soon and move stop into profit.
Trades closed. Have to run a live stream in @ElevateTrading now. This is the kind of stuff you will find inside the group. elevate-trading.com
...and that's how you make $1,400 in a 15 minutes.
Stopped out on the first one but the second and third entries made up for it.
🤝
• • •
Missing some Tweet in this thread? You can try to
force a refresh
💎I spent time doing research on potential stock market "gems" so that you don't have to.
Here's a thread on some stocks I found that have positive criteria to be considered a good mid to long term holding.
Here's a comprehensive breakdown of what I found 👇
1) $UFCS (United Fire Group, Inc.)
Sector: Insurance
Market cap: ~$700 million
Why potential gem?
- Financial resilience: UFCS reported a Q1 net income of $17.7 million (0.67 per diluted share) a 31% increase from a year ago and over 100% increase from Q3 in 2023. The company is debt free with positive free cash flow. This shows strong financial health.
- It's P/E ration is 12.5x which is well below the U.S. Market average of 18.3x meaning it's trading at a potential discount.
- Mid term catalyst - Insurance sector often benefits from rising interest rates. With stabilizing economic conditions UFCS focus on property and casualty insurance should continue to show steady growth.
Technical outlook:
12 month chart:
- Last year showing a bullish engulfing candle
3 month chart:
- Showing bullish structure with a series of higher highs and higher lows.
- Increasing buyer volume the highest in almost 20 years and price sitting right above the key support of 99smma
1 month chart:
- Price making higher highs and higher lows.
- OBV continuing to push higher
- Top Goon X showing momentum reset for only the third time since the year 2000. Previous two occurrences have led to large rallies.
-Price just below 99smma resistance but consolidating and showing increasing buyer volume.
2) $CNDT (Conduent, Inc.)
Sector: Business Process Outsourcing
Overview: Conduent, Inc. engages in the provision of business process services with expertise in transaction-intensive processing, analytics, and automation. It operates through the following segments: Commercial Industries, Government Services, and Transportation.
Market cap: ~$450 million
Why potential gem?
- Conduent has strengthened its balance sheet through a 2024 divestiture program, generating $780 million in post-tax proceeds used for debt repayment and share buybacks. This signals management’s focus on improving shareholder value
- P/E ratio is undefined but their price-to-sales ratio (P/S) of 0.48 is below the S&P 500 average of 5.04, suggesting undervaluation relative to sales
- The key to upside potential will be if Conduent's restructuring efforts translate into earnings growth.
- Mid term catalyst: The company's focus on transaction processing and customer experience management serves stable industries like transportation and government. As economic conditions improve, demand for outsourcing services could rise, boosting revenue.
Technical factors:
- The monthly chart shows price at it's most key support.
- Increasing buyer volume at these lows with a potential bullish morning star reversal pattern.
- This would be a key level for price to hold and provides a close invalidation below for any investors as it would be unfavorable to see price drift to new all time lows as that would likely scare off investors for the foreseeable future.
- Alternatively, a downtrend break would likely give investors more confidence.
If u learn technical analysis & apply it to charts with no bias you'll see how easy it can be
Isn't 100% fool proof but thats where risk management saves u
Most people chart well but can't figure out how to translate it into trading because lack of discipline & strong emotions
Sometimes it's a simple as:
"Look, a bullish engulfing candle at support" And price goes up
But the emotional/undisciplined trader uses too large size immediately after seeing the candle, price drops to retest LTF support & they panic/close at the bottom before price goes up
Low time frame short set up to watch out for a breakdown entry.
Got a small entry on the breakdown and just added another entry up here with mega tight stop. Have a feeling this won't work out but it's with-in my risk parameters so I'll take the stop loss hit if it hapens.