IPCC AR6 WG1 🧵
Some initial comments
Think of these as working notes
Comments welcomed
Let's go . . .
Some initial comments
Think of these as working notes
Comments welcomed
Let's go . . .
Let's start with scenarios
This is rather huge
"In general, no likelihood is attached to the scenarios assessed in this Report"
So that means that users of the scenarios have to independently assess likelihoods
This is rather huge
"In general, no likelihood is attached to the scenarios assessed in this Report"
So that means that users of the scenarios have to independently assess likelihoods

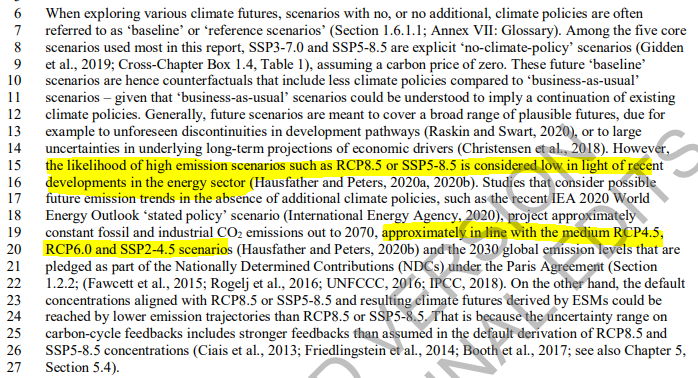
That said: "the likelihood of high emission scenarios such as RCP8.5 or SSP5-8.5 is considered low"
They also said that an appropriate scenario for "absence of additional climate policies" (aka BAU) is "RCP4.5, RCP6.0 and SSP2-4.5 scenarios:
They said it, kudos to IPCC WG1🔥🔥
They also said that an appropriate scenario for "absence of additional climate policies" (aka BAU) is "RCP4.5, RCP6.0 and SSP2-4.5 scenarios:
They said it, kudos to IPCC WG1🔥🔥
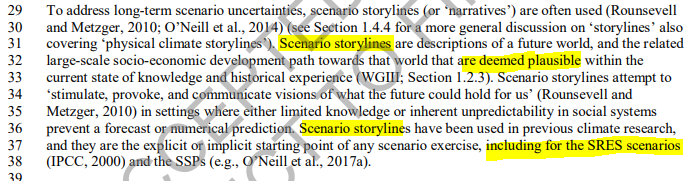
I won't get down too far in the weeds but the IPCC WG1 has returned to the SRES storyline approach
That means that interpretation of the scenarios and the resulting projections will be trickier than saying that the IPCC is projecting X or Y future
It is a healthy development!
That means that interpretation of the scenarios and the resulting projections will be trickier than saying that the IPCC is projecting X or Y future
It is a healthy development!
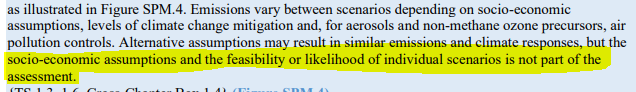
Underscoring this absolutely essential point
"the socio-economic assumptions and the feasibility or likelihood of individual scenarios is not part of the assessment"
Fortunately, you are in good hands here as we have been studying feasibility in great detail, more on that later
"the socio-economic assumptions and the feasibility or likelihood of individual scenarios is not part of the assessment"
Fortunately, you are in good hands here as we have been studying feasibility in great detail, more on that later
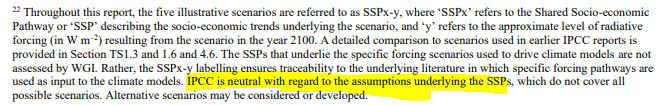
Very important:
"IPCC is neutral with regard to the assumptions underlying the SSPs"
So IPCC recognizes that 8.5 scenarios have "low likelihood" but nonetheless choose to remain "neutral" with respect to scenario assumptions
As we will see, this is not quite right in practice
"IPCC is neutral with regard to the assumptions underlying the SSPs"
So IPCC recognizes that 8.5 scenarios have "low likelihood" but nonetheless choose to remain "neutral" with respect to scenario assumptions
As we will see, this is not quite right in practice
So which scenarios does IPCC focus AR6?
If "neutral" we might assume a fairly equal focus of attention across scenarios (similar to how SRES was used) since WG1 AR6 judges none more likely than another
On the other hand the literature is heavily biased to extreme scenarios...
If "neutral" we might assume a fairly equal focus of attention across scenarios (similar to how SRES was used) since WG1 AR6 judges none more likely than another
On the other hand the literature is heavily biased to extreme scenarios...
So this is a BIG problem
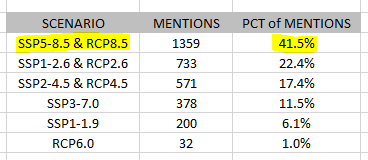
The scenarios IPCC admits are unlikely dominate the report w/ 41.5% of all scenario mentions
The scenarios judged most likely under current trends get only 18.4% of mentions
Implausible scenarios (8.5 + 7.0) total 53% of mentions, more than half!
The scenarios IPCC admits are unlikely dominate the report w/ 41.5% of all scenario mentions
The scenarios judged most likely under current trends get only 18.4% of mentions
Implausible scenarios (8.5 + 7.0) total 53% of mentions, more than half!
From AR5 WG1 to AR6 WG1 the emphasis on 8.5 scenarios increased dramatically
Table below shows RCP8.5 mentions in AR5 WG1 were 31.4% of total scenario mentions, that has increased to 41.5% in AR6
Focus on more realistic scenarios (4.5 & 6.0) dropped from 44.5% to 18.4%
Wow
Table below shows RCP8.5 mentions in AR5 WG1 were 31.4% of total scenario mentions, that has increased to 41.5% in AR6
Focus on more realistic scenarios (4.5 & 6.0) dropped from 44.5% to 18.4%
Wow
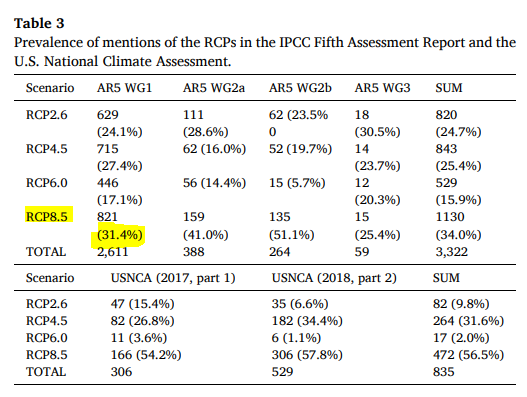
AR5 table in previous Tweet from this paper:
doi.org/10.1016/j.erss…
doi.org/10.1016/j.erss…
The IPCC AR6 WG1 is not in fact neutral w/ respect to scenario assumptions because it has a overwhelming emphasis on unlikely (it's word), implausible (our word) scenarios
Because IPCC also claims no likelihoods associated w/ scenarios the emphasis on 8.5 needs interpretation
Because IPCC also claims no likelihoods associated w/ scenarios the emphasis on 8.5 needs interpretation
We have already explained the over-reliance on implausible 8.5 scenarios in terms of momentum in science
Other factors at play also
See these two papers:
1-Readable overview (free to read): issues.org/climate-change…
2-Lots of details (DM for a copy): doi.org/10.1016/j.erss…
Other factors at play also
See these two papers:
1-Readable overview (free to read): issues.org/climate-change…
2-Lots of details (DM for a copy): doi.org/10.1016/j.erss…
But with its over-reliance on 8.5 scenarios the IPCC WG1 has set itself up for appropriate criticism from friends and foes alike
The unexpected u-turn in use of scenarios from AR5 has also set the stage for confusion among experts, media and policy makers
The unexpected u-turn in use of scenarios from AR5 has also set the stage for confusion among experts, media and policy makers
This also is big & it's v good news
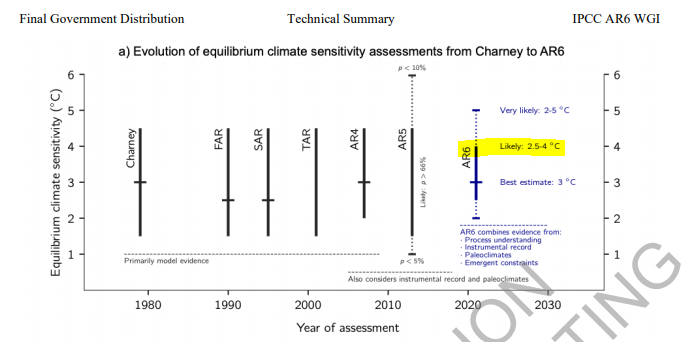
The IPCC has for the first time reduced its top end estimate of climate sensitivity
IPCC judges Higher magnitude climate change to be less likely than it has been since 1990
Best estimate remains same, lower end certainty increased as well
The IPCC has for the first time reduced its top end estimate of climate sensitivity
IPCC judges Higher magnitude climate change to be less likely than it has been since 1990
Best estimate remains same, lower end certainty increased as well
Please keep the comments & requests for our paper coming
OK, now to extremes . . .
OK, now to extremes . . .
Ch.8 on flooding:
"the assessment of observed trends in the magnitude of runoff, streamflow, and flooding remains challenging, due to the spatial heterogeneity of the signal and to multiple drivers"
Same as AR5
Are floods increasing? Evidence doesn't say that
"the assessment of observed trends in the magnitude of runoff, streamflow, and flooding remains challenging, due to the spatial heterogeneity of the signal and to multiple drivers"
Same as AR5
Are floods increasing? Evidence doesn't say that
Temperature extremes
Heat waves increasing at global scale (virtually certain)
Heat waves increasing at global scale (virtually certain)

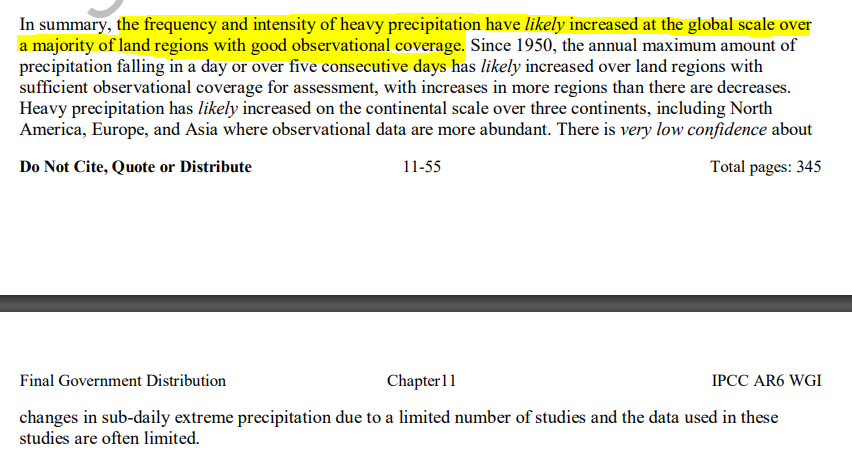
Heavy precipitation
Frequency and intensity have increased at a global scale (of note, only "likely" >66% certainty)
Frequency and intensity have increased at a global scale (of note, only "likely" >66% certainty)
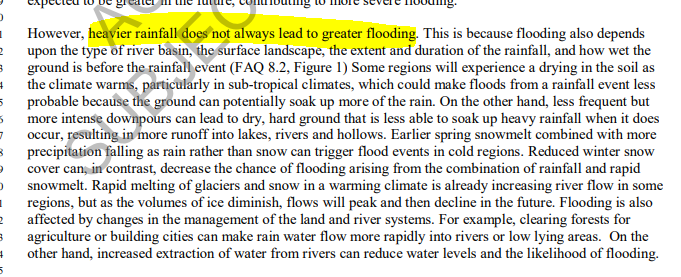
I'm very happy to see that the IPCC has acknowledged that heavier precipitation does not equate to increased flooding: "heavier rainfall does not always lead to greater flooding"
We explained this in 1999 (Pielke and Downton 1999)😎
We explained this in 1999 (Pielke and Downton 1999)😎
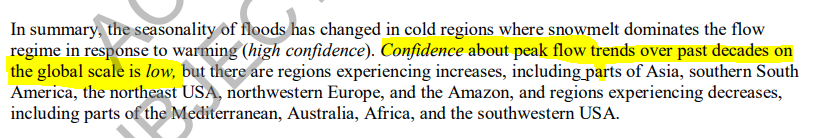
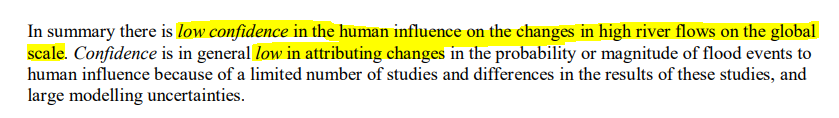
Flooding
Confidence in global trends is low
Some places up, some down
Same as AR5
So don't claim floods are increasing
Don't say they are "climate driven"
Confidence in global trends is low
Some places up, some down
Same as AR5
So don't claim floods are increasing
Don't say they are "climate driven"
Obviously in the absence of detected trends, there won't be much ability to attribute
Don't say floods are caused by, driven by, intensified by climate change. The evidence doesn't support that.
Don't say floods are caused by, driven by, intensified by climate change. The evidence doesn't support that.
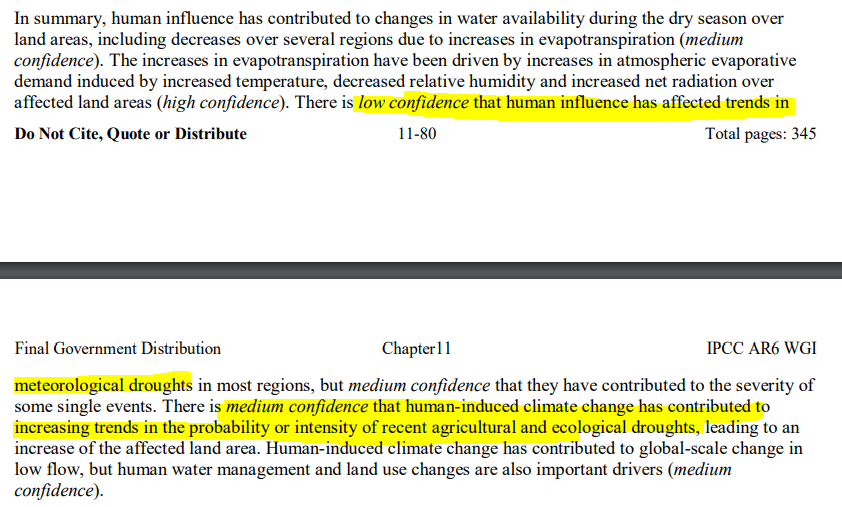
AR5 discussed "drought"
AR6 discusses 4 types: meteorological, hydrological, agricultural, ecological
Different conclusions for each
Like AR5, little confidence in changes to M or H droughts but medium confidence in changes to A & E
AR6 discusses 4 types: meteorological, hydrological, agricultural, ecological
Different conclusions for each
Like AR5, little confidence in changes to M or H droughts but medium confidence in changes to A & E
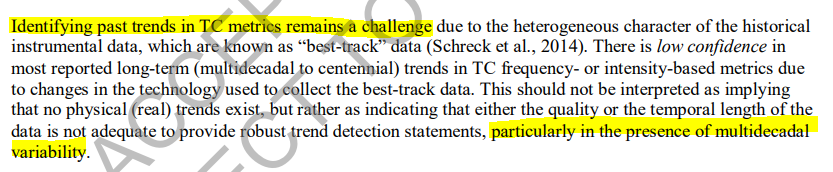
Detecting trends in tropical cyclones remains difficult, same as AR5
There might be trends, but we can't detect them (I always love this statement, if we can't detect it, it can't be that significant!)
There might be trends, but we can't detect them (I always love this statement, if we can't detect it, it can't be that significant!)
This is awesome
A clear indication that I am Voldemort at IPCC ;-)
Also clear evidence of cherry picking tsk tsk
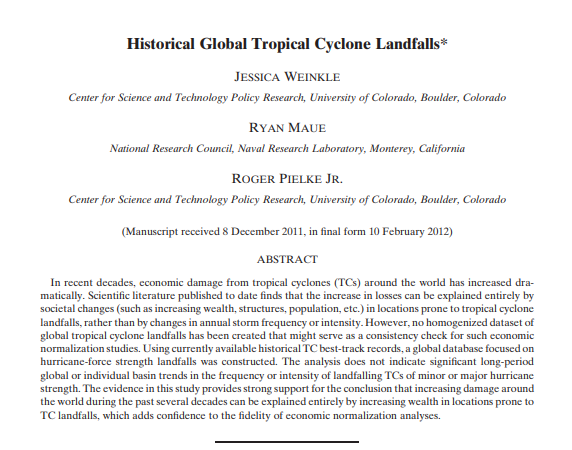
They reference normalized hurricane damage & cite a fringe analysis with 24 citations while ignoring the definitive work with 1196 citations
A clear indication that I am Voldemort at IPCC ;-)
Also clear evidence of cherry picking tsk tsk
They reference normalized hurricane damage & cite a fringe analysis with 24 citations while ignoring the definitive work with 1196 citations


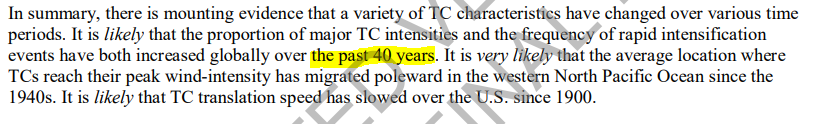
The IPCC really stretches to say something about TCs, relying on a few studies that start analysis in 1980 when much more evidence is available
You know what the IPCC doesn't mention?
Global TC landfalls (they do mention landfalls in Madagascar and the US)
I wonder why not?
Our dataset was updated & published in recent WMO TC assessment
Global TC landfalls (they do mention landfalls in Madagascar and the US)
I wonder why not?
Our dataset was updated & published in recent WMO TC assessment
Curious about what the IPCC forgot to include?
For NA & WP, about 70% of all landfalls, "the overall number of landfalling hurricanes has decreased dramatically since the 1940s, while the number of major hurricane landfalls has shown no trend"
rogerpielkejr.substack.com/p/a-remarkable…
For NA & WP, about 70% of all landfalls, "the overall number of landfalling hurricanes has decreased dramatically since the 1940s, while the number of major hurricane landfalls has shown no trend"
rogerpielkejr.substack.com/p/a-remarkable…

Last point on the cherry picking by IPCC
I & colleagues certainly must be the most widely cited authors on extremes & climate not to make it into the IPCC AR6 extreme chapter
It's fine
Says a lot more about IPCC than it does our peer-reviewed work
Back to the report . . .
I & colleagues certainly must be the most widely cited authors on extremes & climate not to make it into the IPCC AR6 extreme chapter
It's fine
Says a lot more about IPCC than it does our peer-reviewed work
Back to the report . . .
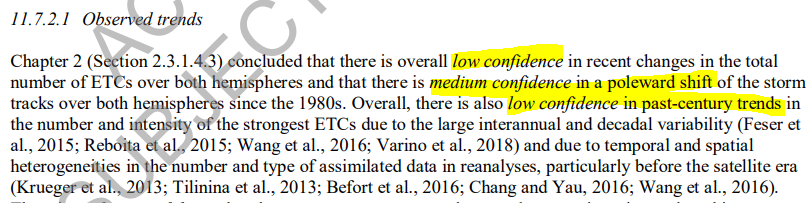
Winter storms
Low confidence in past century trends in frequency and intensity
Low confidence in past century trends in frequency and intensity
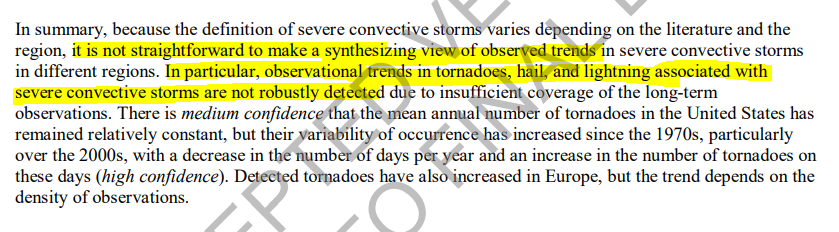
Thunderstorms, tornadoes, hail, lightning
No upwards trends detected
Same as AR5
No upwards trends detected
Same as AR5
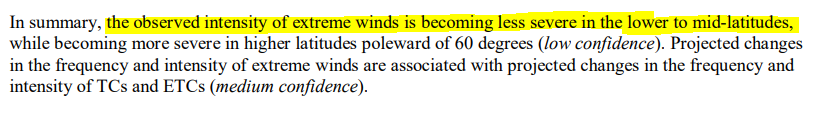
Extreme winds
A new variable in AR6
Interesting, IPCC finds less extreme winds between 60N (~Juneau) and 60S (~Antarctica), so pretty much everywhere there are people
There goes the derecho attribution
A new variable in AR6
Interesting, IPCC finds less extreme winds between 60N (~Juneau) and 60S (~Antarctica), so pretty much everywhere there are people
There goes the derecho attribution
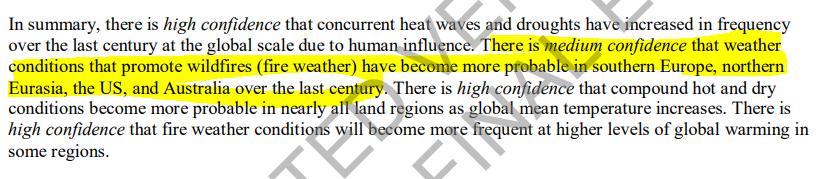
Fire weather
"There is medium confidence that weather conditions that promote wildfires (fire weather) have become more probable in southern Europe, northern Eurasia, the US, and Australia over the last century"
"There is medium confidence that weather conditions that promote wildfires (fire weather) have become more probable in southern Europe, northern Eurasia, the US, and Australia over the last century"
Summary:
Highly consistent with AR5 (of course, just a few more years of data)
Little evidence of increasing trends in floods, M&H drought, TCs, tornadoes, strong winds
But evidence for increases in high temps, extreme precip, heat waves, fire weather, A&E drought
Highly consistent with AR5 (of course, just a few more years of data)
Little evidence of increasing trends in floods, M&H drought, TCs, tornadoes, strong winds
But evidence for increases in high temps, extreme precip, heat waves, fire weather, A&E drought
That's all for now
I'll now catch up on the many comments
Respond to paper requests
Thanks for reading!
I'll now catch up on the many comments
Respond to paper requests
Thanks for reading!
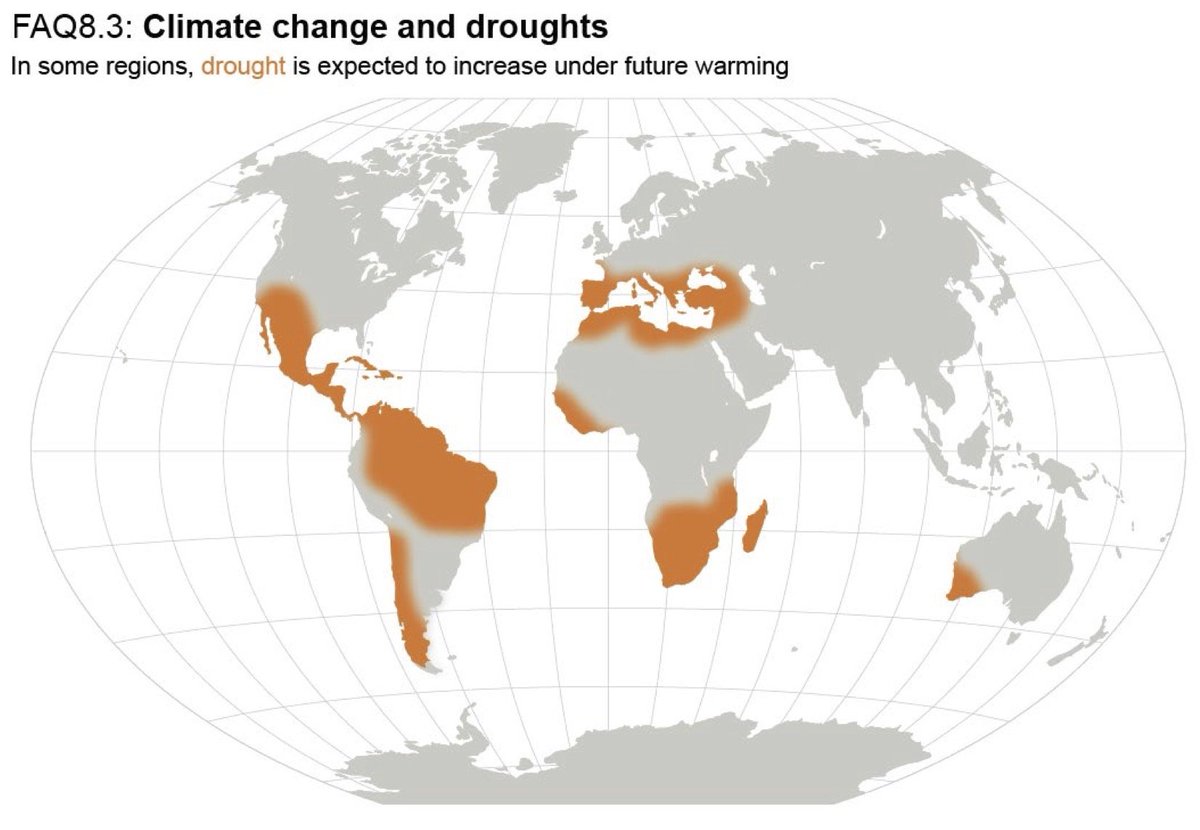
I found this IPCC figure on drought to be surprising
No expected increase in drought in most of North America, eastern Australia, Northern Europe, Asia - including India, Russia and China ... in other words where almost all of humanity lives
This has to be v good news, right?
No expected increase in drought in most of North America, eastern Australia, Northern Europe, Asia - including India, Russia and China ... in other words where almost all of humanity lives
This has to be v good news, right?
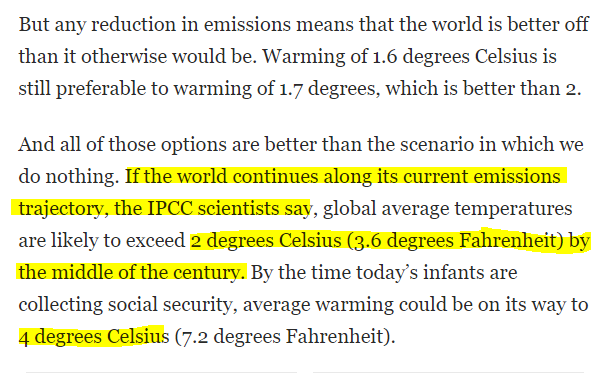
Reporting on IPCC report hasn't been great
L-Wash Post
No
IPCC says current policies give 2.7 deg C for 2100
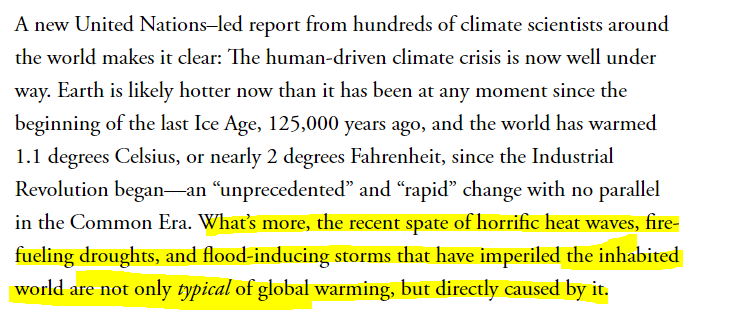
R-The Atlantic
No
IPCC says nothing remotely like this
This isn't about specific reporters but about reporting
There is a apocalypse auction going on
And we're buying
L-Wash Post
No
IPCC says current policies give 2.7 deg C for 2100
R-The Atlantic
No
IPCC says nothing remotely like this
This isn't about specific reporters but about reporting
There is a apocalypse auction going on
And we're buying
• • •
Missing some Tweet in this thread? You can try to
force a refresh