
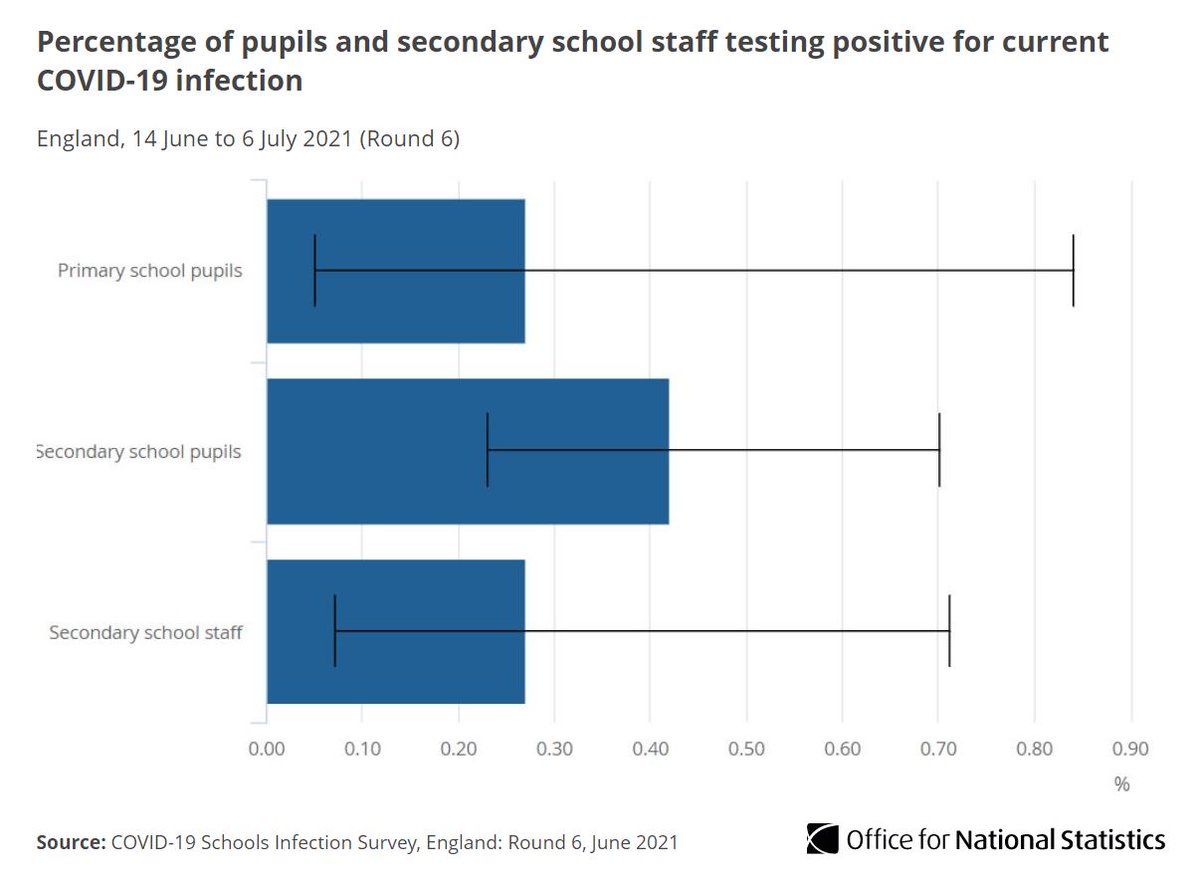
Our Schools Infection Survey shows #COVID19 infection rates were lower in the summer term of 2021 than in autumn 2020, with infection rates in June 2021 as follows:
▪️ primary pupils = 0.27%
▪️ secondary pupils = 0.42%
▪️ secondary staff = 0.27%
➡️ ow.ly/oIG650FOJb7
▪️ primary pupils = 0.27%
▪️ secondary pupils = 0.42%
▪️ secondary staff = 0.27%
➡️ ow.ly/oIG650FOJb7
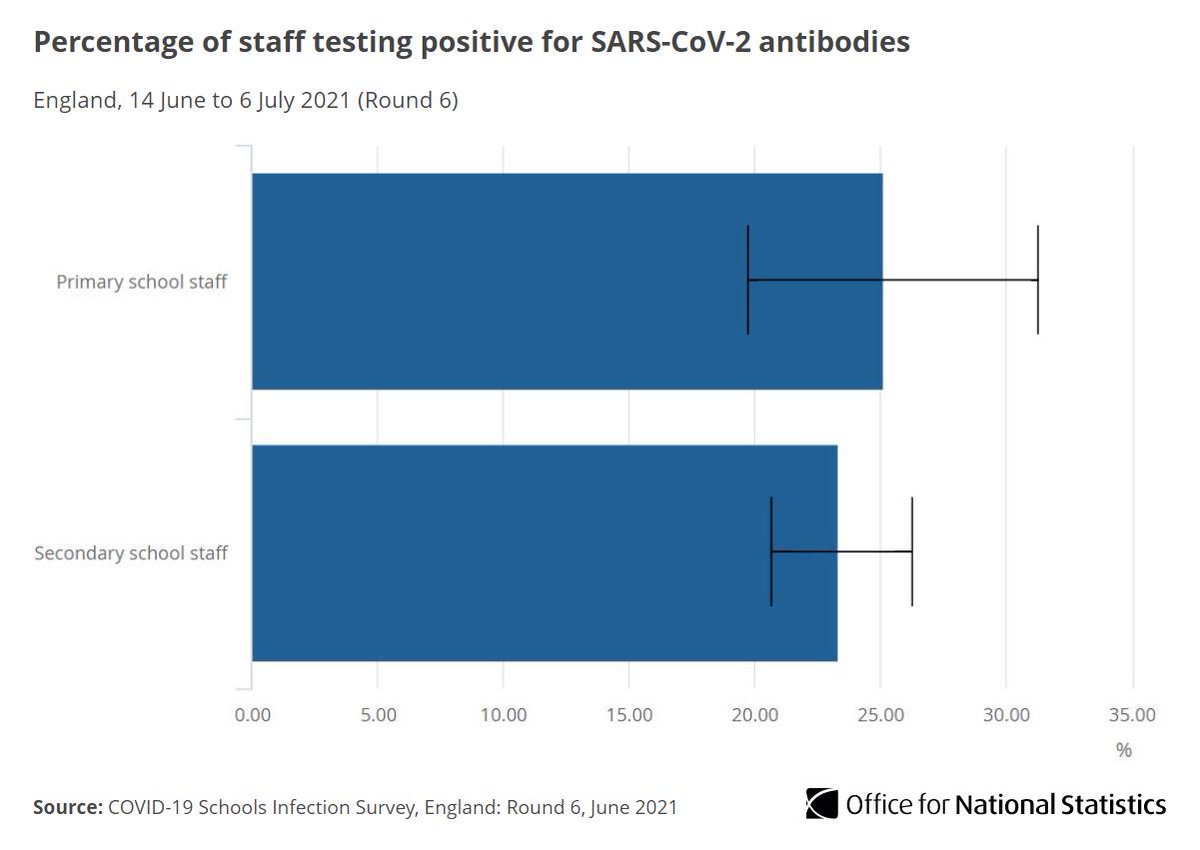
25.16% of primary school staff and 23.36% of secondary school staff tested positive for #COVID19 antibodies in June 2021 ow.ly/RKDj50FOJdk
By the end of June 2021, 92.93% of staff had received at least 1 dose and 70.47% had received 2 doses of a #COVID19 vaccine, @NHSEngland data show.
This relates to 14 local authorities, differing from NHS data published weekly, and can’t be generalised ow.ly/RBPB50FOJfs
This relates to 14 local authorities, differing from NHS data published weekly, and can’t be generalised ow.ly/RBPB50FOJfs
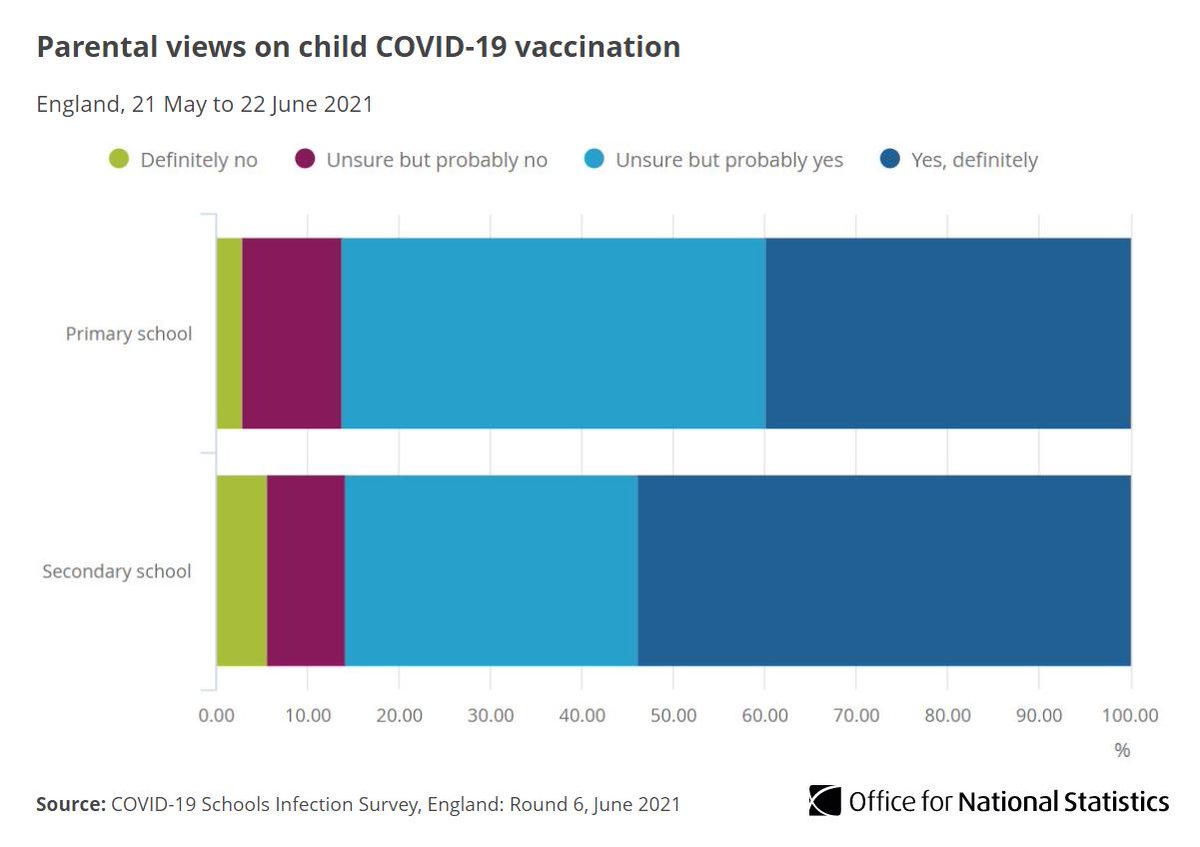
40% of primary school parents and 54% of secondary school parents would definitely want their child to have a #COVID19 vaccine if offered.
Only 3% of primary and 6% of secondary school parents would definitely not want their child to have a vaccine ow.ly/l3wU50FOJgF
Only 3% of primary and 6% of secondary school parents would definitely not want their child to have a vaccine ow.ly/l3wU50FOJgF
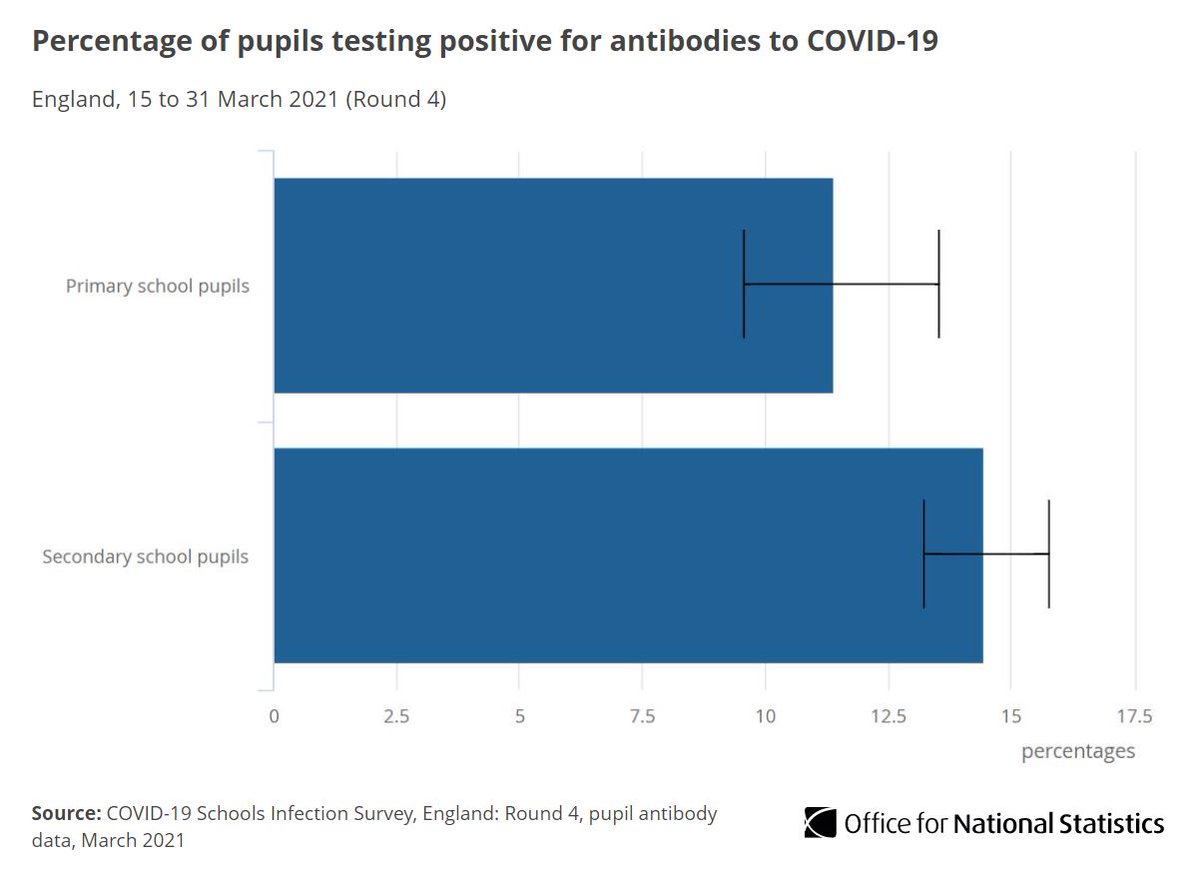
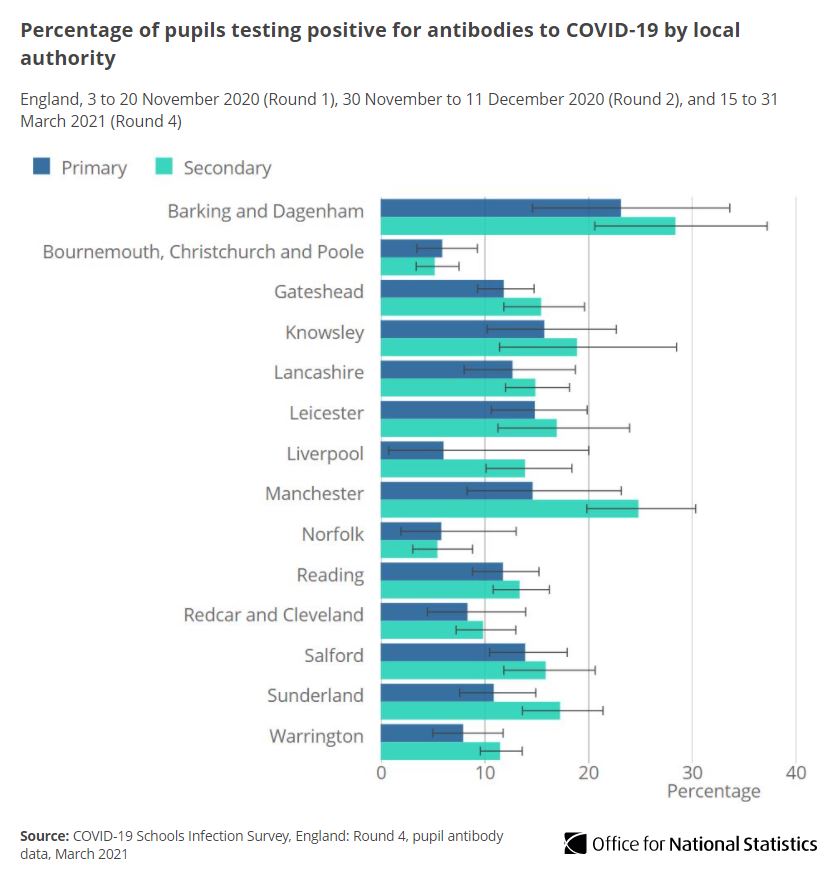
We’ve also released the fourth round of results from our Schools Infection Survey focusing on #COVID19 antibodies.
Results show 11.41% of primary school pupils and 14.45% of secondary school pupils tested positive for COVID-19 antibodies in March 2021 ow.ly/tRp750FOJjM
Results show 11.41% of primary school pupils and 14.45% of secondary school pupils tested positive for COVID-19 antibodies in March 2021 ow.ly/tRp750FOJjM
In March 2021, the regions in the study with the highest percentage of secondary school pupils that tested positive for #COVID19 antibodies were
▪️ Manchester (24.85%)
▪️ Barking and Dagenham (28.42%)
Bournemouth & Norfolk had the lowest (5.21% & 5.47%) ow.ly/OQ3z50FOJmU
▪️ Manchester (24.85%)
▪️ Barking and Dagenham (28.42%)
Bournemouth & Norfolk had the lowest (5.21% & 5.47%) ow.ly/OQ3z50FOJmU
• • •
Missing some Tweet in this thread? You can try to
force a refresh


