Here is your inflation scorecard. For context, as recently as two months ago people were speculating that we "might" get 3% inflation this year.
We've already had 4.1% CPI this year, if prices are flat for the rest of the year that's the annual inflation we'll have.
We've already had 4.1% CPI this year, if prices are flat for the rest of the year that's the annual inflation we'll have.

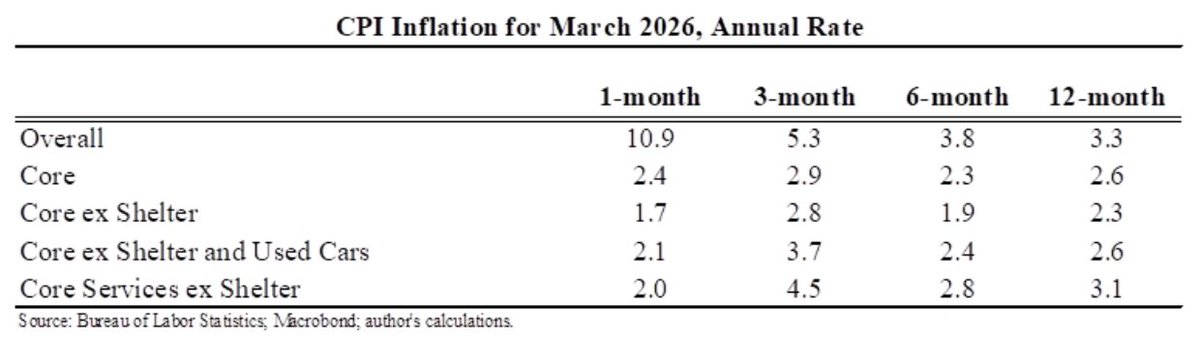
As recently as two months ago forecasters saw essentially no chance that core CPI would be 4% this year. Now it would take monthly prints slowing down from 0.48% to 0.13% (or a 1.6% annual rate) to keep inflation down this low.
Inflation moderated in July because the unusually large vehicles category moderated (as widely expected). The underlying inflation rate remained relatively strong. If core inflation continued at this month's rate for a year that would be 4.1% annual inflation.

(As an aside, the idea that vehicle price increases are just supply is implausible. They are partly supply but also a huge increase in demand due to stimulus checks, new car prices especially appear to reflect higher willingness to pay more than shortages.)
This is not base effects or transitory categories. The price increases we've seen have been widespread & not just a few freakish categories. Taking out food, shelter, energy and used cars/trucks (a standard BLS series), prices are above trend and rising faster than trend.

One way to see this is the comparison between the US and Europe. Using the comparable European methodology, the US has had annual inflation at a 3.3% over the last two years, Euro Area has been just 1.3%.
(My view: US too high and Europe too low.)
(My view: US too high and Europe too low.)

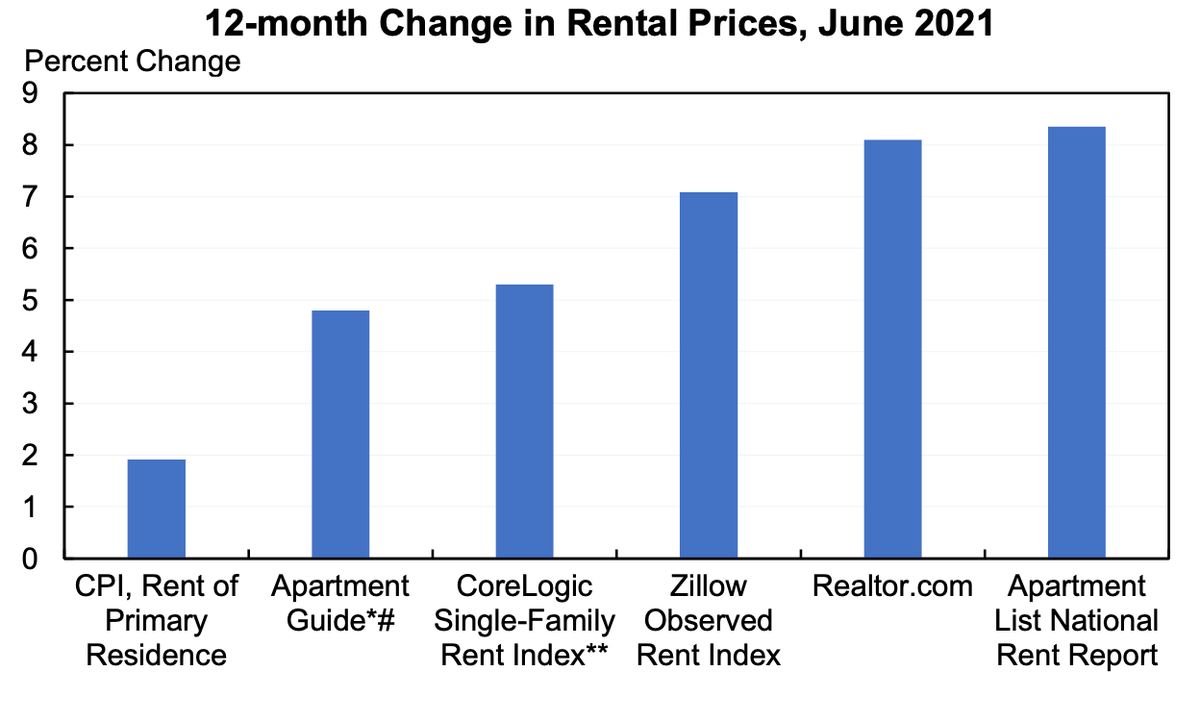
Finally, some shoes have yet to drop. Rent was really low again this month (+0.2%) and owner's equivalent rent also low (+0.3%). Overall shelter is below trend and likely to rise faster. This would be huge for the CPI and large for the PCE.

Using month-old data, a number of other rent measures are tracking much faster than the CPI. Some of this is conceptual differences (not all apples-to-apples) but some is that the CPI lags based on infrequent interviews to update.
And a policy-related addendum: I view inflation as primarily an issue for monetary policy (plus some supply chain untangling), not fiscal policy. I don't think the infrastructure bill or reconciliation plan would materially impact inflation over the next decade.
• • •
Missing some Tweet in this thread? You can try to
force a refresh