Stuart A Profile picture
Aug 13, 2021 6 tweets 5 min read Read on X
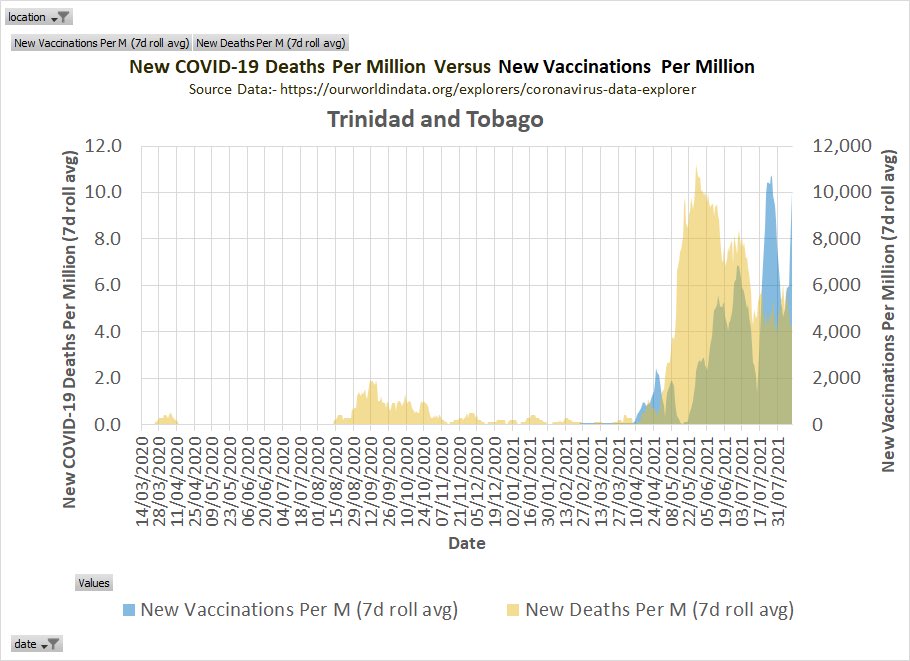
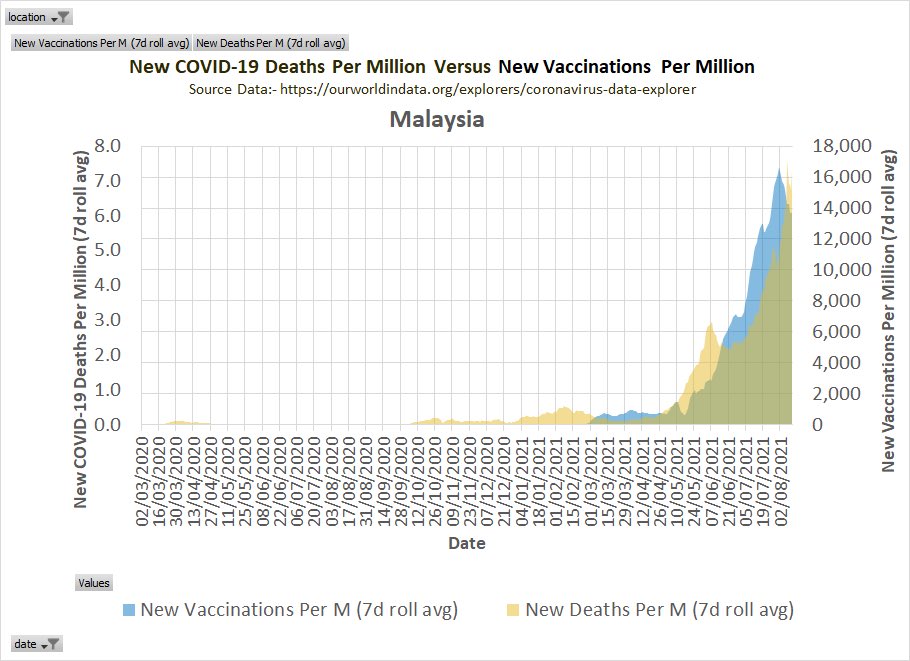
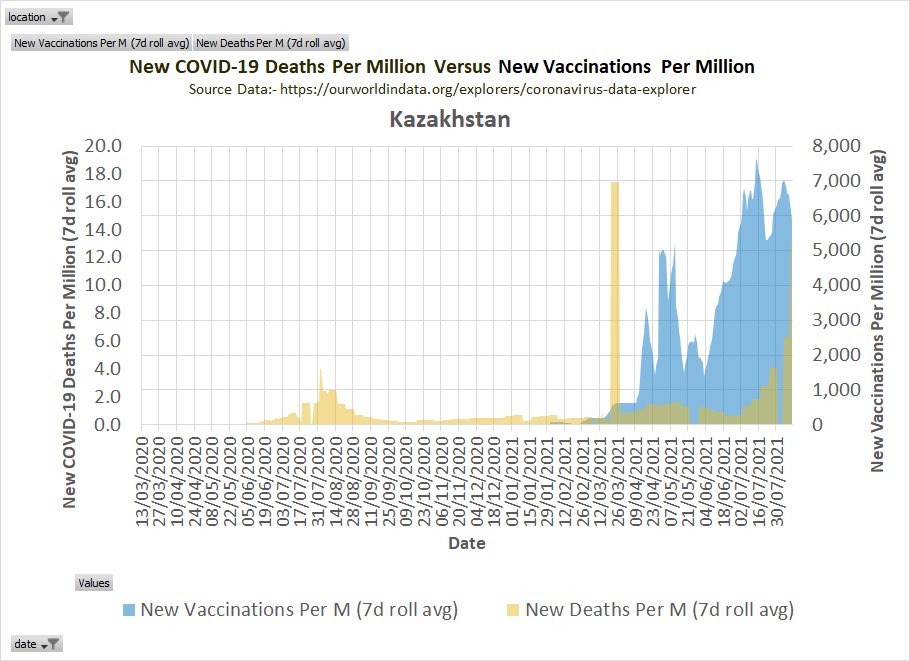
Plotting vaccination rates and CV19 death rates of the 20 countries which currently have the highest daily CV19 death rates according to Our World in Data…. ImageImageImageImage
ImageImageImageImage

• • •

Missing some Tweet in this thread? You can try to force a refresh
 

Keep Current with Stuart A

Stuart A Profile picture

Stay in touch and get notified when new unrolls are available from this author!

Read all threads

This Thread may be Removed Anytime!

PDF

Twitter may remove this content at anytime! Save it as PDF for later use!

Try unrolling a thread yourself!

how to unroll video
  1. Follow @ThreadReaderApp to mention us!

  2. From a Twitter thread mention us with a keyword "unroll"
@threadreaderapp unroll

Practice here first or read more on our help page!

More from @OutsideAllan

Feb 21
It looks like the Office for Health Improvement and Disparities 🏴󠁧󠁢󠁥󠁮󠁧󠁿 will no longer be releasing Excess Mortality data, so here are the heat maps for one last time…

1. Non-COVID by Age Group… Image
2. All Causes by Age Group.. Image
3. By Cause (excluding COVID)… Image
Read 7 tweets
Apr 3, 2023
England 🏴󠁧󠁢󠁥󠁮󠁧󠁿

Specific causes of death that have significantly increased during 2021/2022.

(Not all causes have significantly increased - these are just ones that stand out).

Part 1 - Circulatory
Read 5 tweets
Aug 19, 2022
England 🏴󠁧󠁢󠁥󠁮󠁧󠁿

Cumulative Excess Deaths NOT Involving CV19.

Comparing weeks 1-31 2022 v 2021 by Age Group & Sex.

0-24 big gap between males and females…
25-49. Less than expected for the first 20 weeks of 2022 but has changed direction since then…
50-64. Males not looking good with over 900 excess deaths in the last 14 weeks…
Read 6 tweets
May 16, 2022
England 🏴󠁧󠁢󠁥󠁮󠁧󠁿 Excess Deaths NOT Involving CV19.

Since Mar 2020 there have been 58,443 more Deaths Involving CV19 than Excess Deaths = 58,443 fewer Non-CV19 Deaths than expected.

During the 2nd half of 2021, however, there were 6,331 more Non-CV19 deaths than expected… ImageImage
Charts show cumulative Non-CV19 excess for 2nd half of 2021…

In the 0-24 and 25-49 age groups there were significantly more excess in Males than in Females.

What caused this excess? Why is it higher in Males than Females? ImageImage
Higher number of excess deaths in the 50-64 group than the 65-74 group with males being hit the hardest. ImageImage
Read 6 tweets
Nov 9, 2021
England 🏴󠁧󠁢󠁥󠁮󠁧󠁿 & Wales 🏴󠁧󠁢󠁷󠁬󠁳󠁿

More detailed look at mortality in the 15-19 age group…

Cumulative Weeks 1 to 43 Males and Females.

Comparing 2021 with 2019 and 2020, Males diverge from week 23.
Adjusting for changes in population size…
Zooming in on Males from week 22.
One chart shows number of deaths, the other deaths per 100K population…
Read 7 tweets
Oct 13, 2021
Scotland 🏴󠁧󠁢󠁳󠁣󠁴󠁿

Excess deaths by underlying cause based on latest data released today.

Excess Deaths NOT Due to COVID-19 are 11.6% higher than the 2015-2019 average (for the last 8 weeks) and appear to be trending upwards…
%Deviation from 2015-2019 average by underlying cause…
Read 4 tweets

Did Thread Reader help you today?

Support us! We are indie developers!


This site is made by just two indie developers on a laptop doing marketing, support and development! Read more about the story.

Become a Premium Member ($3/month or $30/year) and get exclusive features!

Become Premium

Don't want to be a Premium member but still want to support us?

Make a small donation by buying us coffee ($5) or help with server cost ($10)

Donate via Paypal

Or Donate anonymously using crypto!

Ethereum

0xfe58350B80634f60Fa6Dc149a72b4DFbc17D341E copy

Bitcoin

3ATGMxNzCUFzxpMCHL5sWSt4DVtS8UqXpi copy

Thank you for your support!

Follow Us!

:(