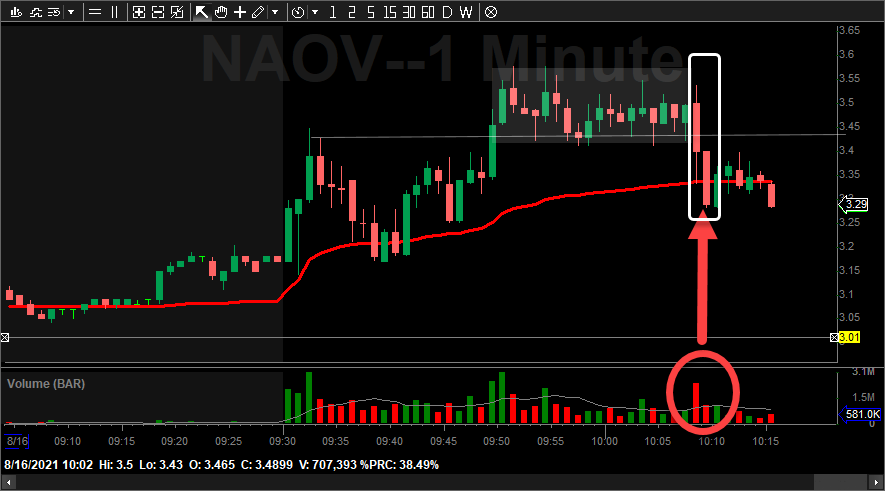
Still can't trade $NAOV, but this is the short signal I would have entered on. HOD clearout, shelf, then higher volume break. If it reclaims 3.45 plus might push higher, other wise 3.10s and lower would have been targets
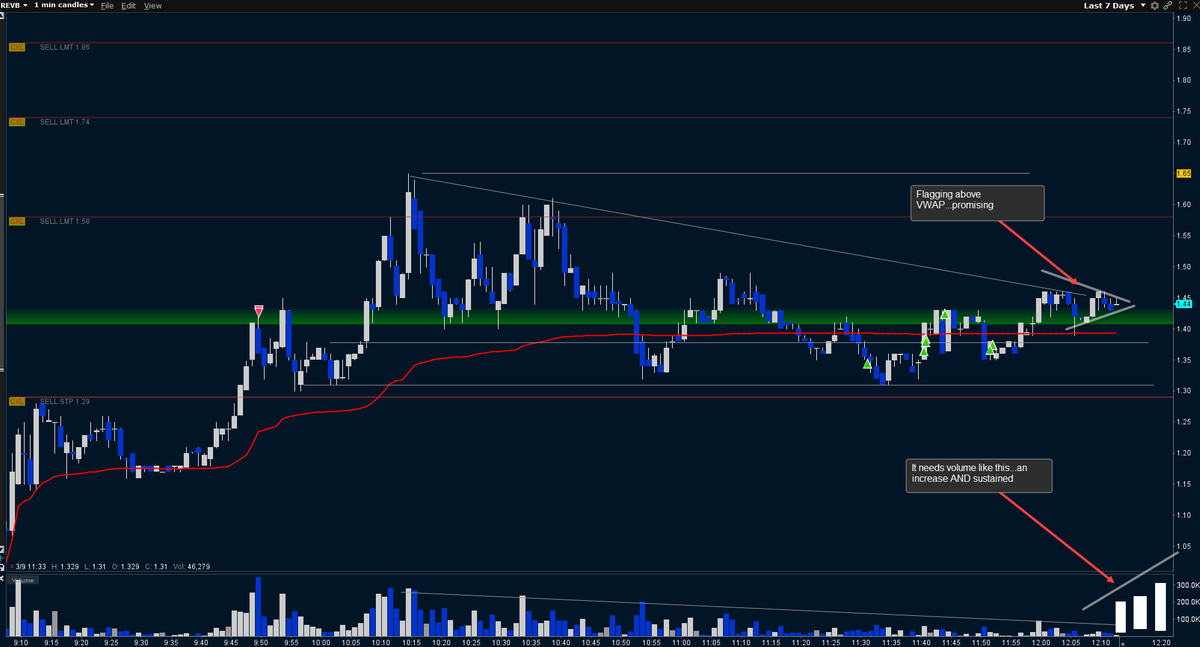
Think of the range that's created by flush moves like a stoplight...lower zone good (Green), mid zone warning (yellow), top of zone bad (red).
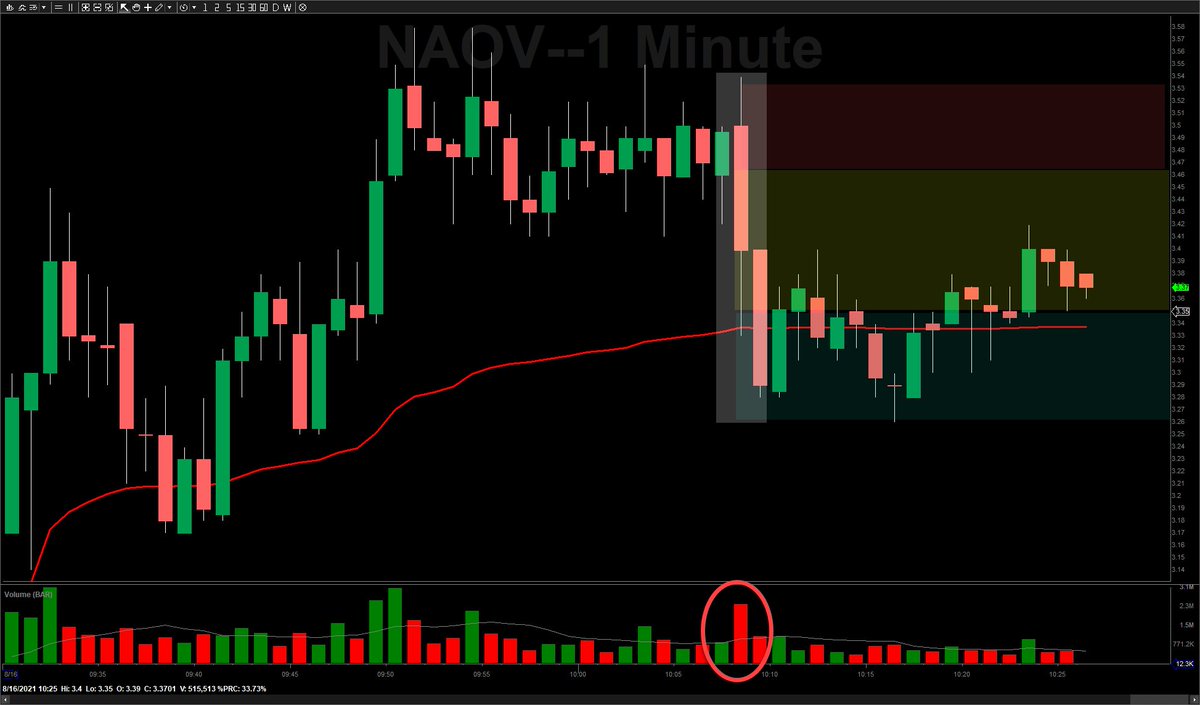
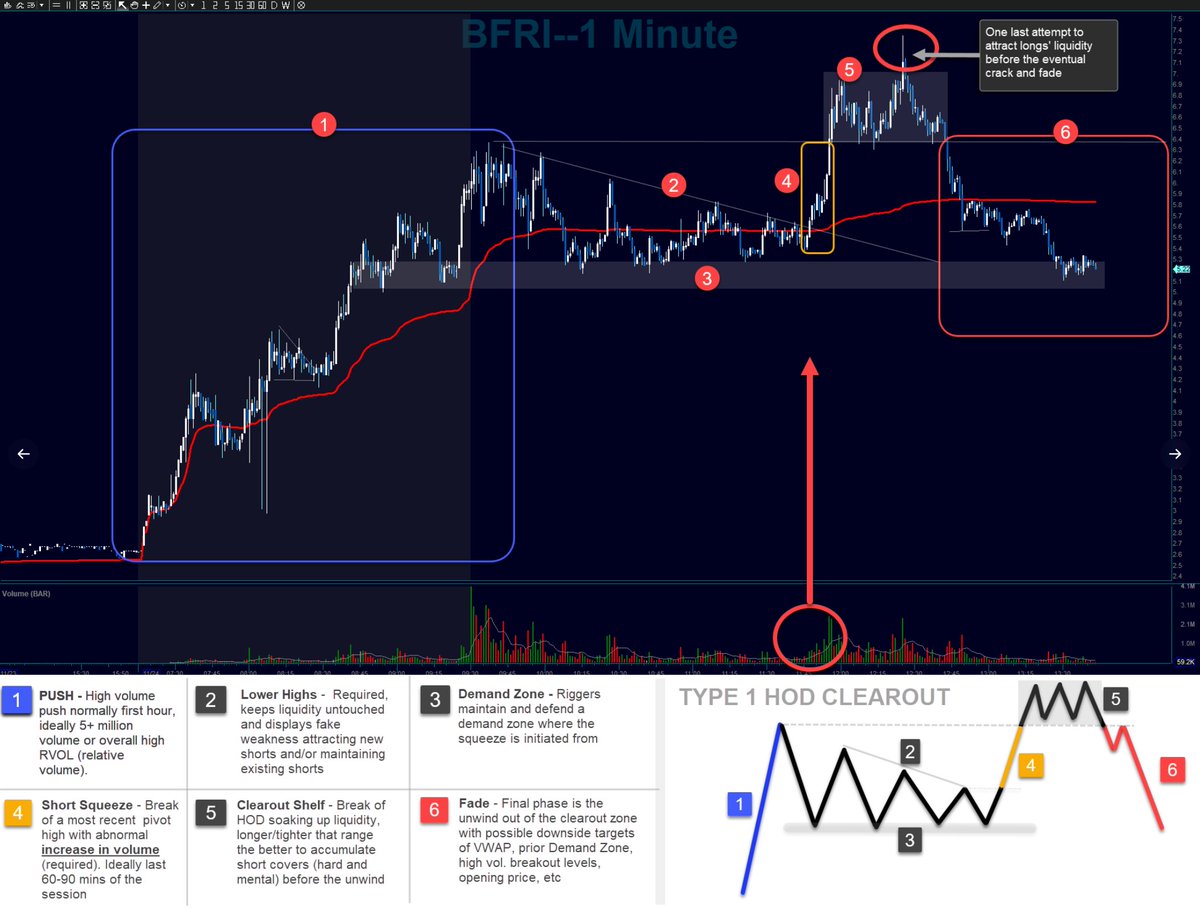
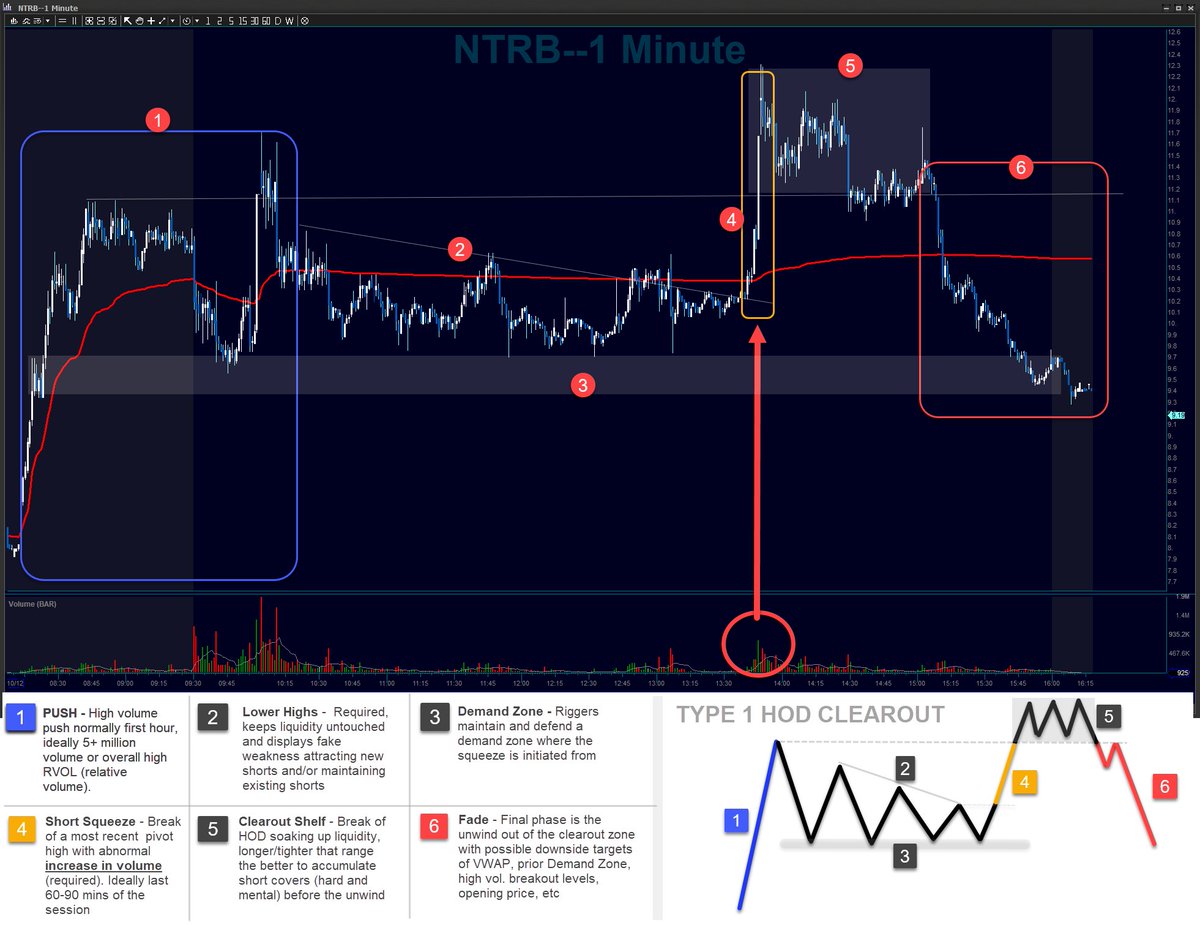
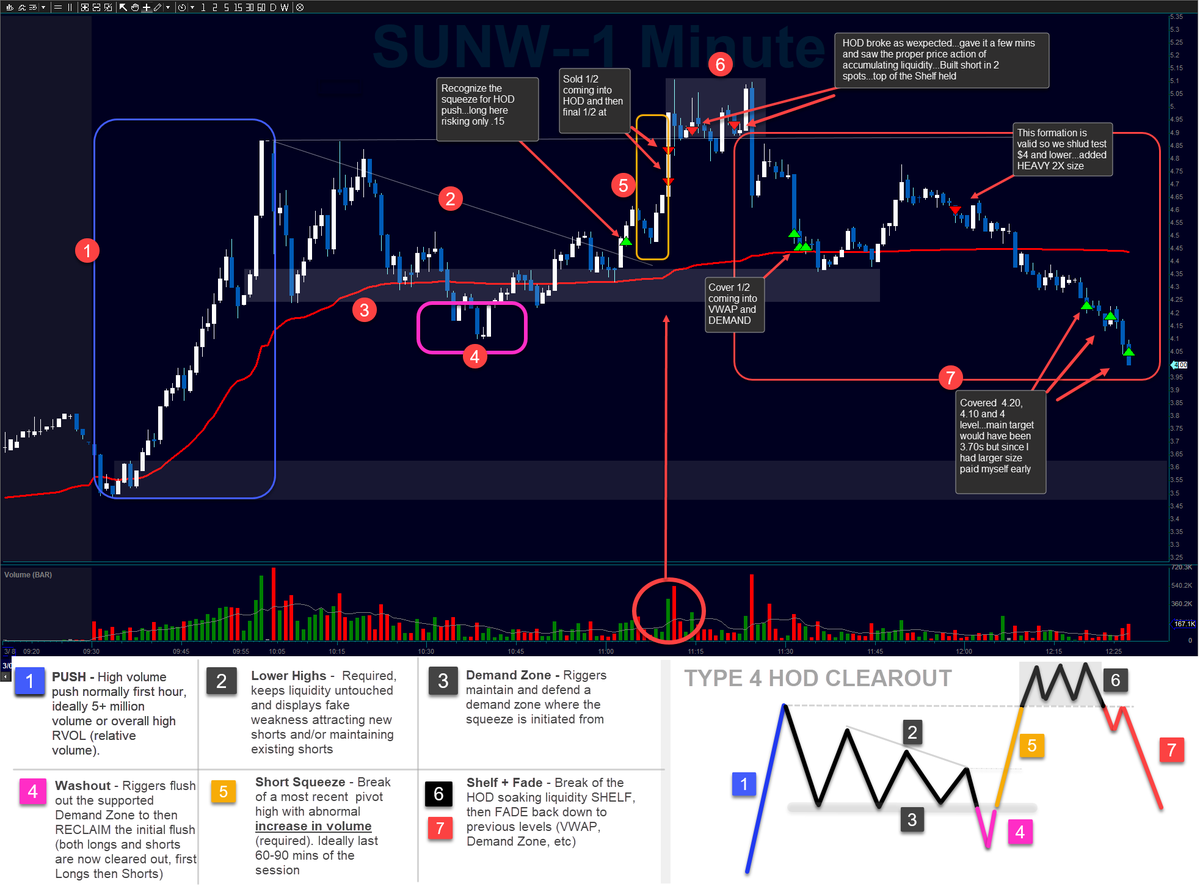
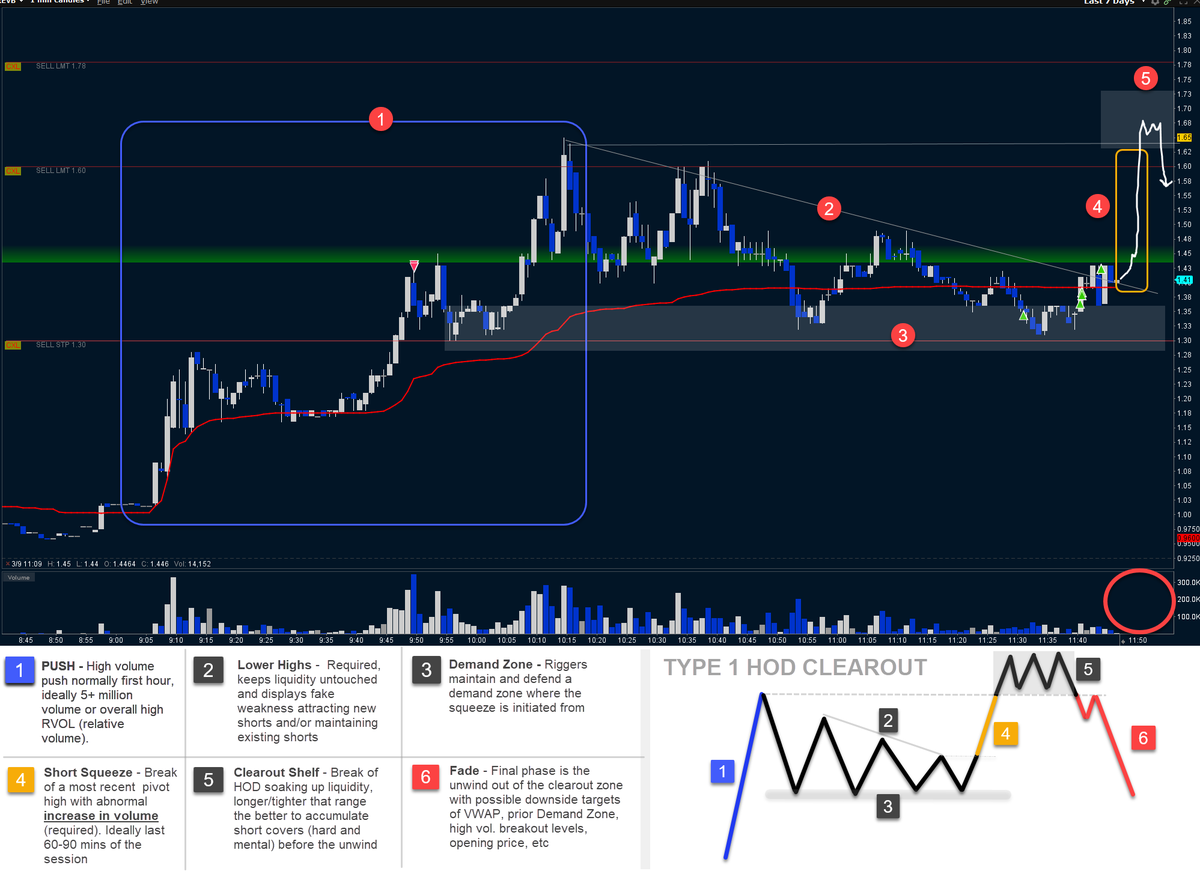
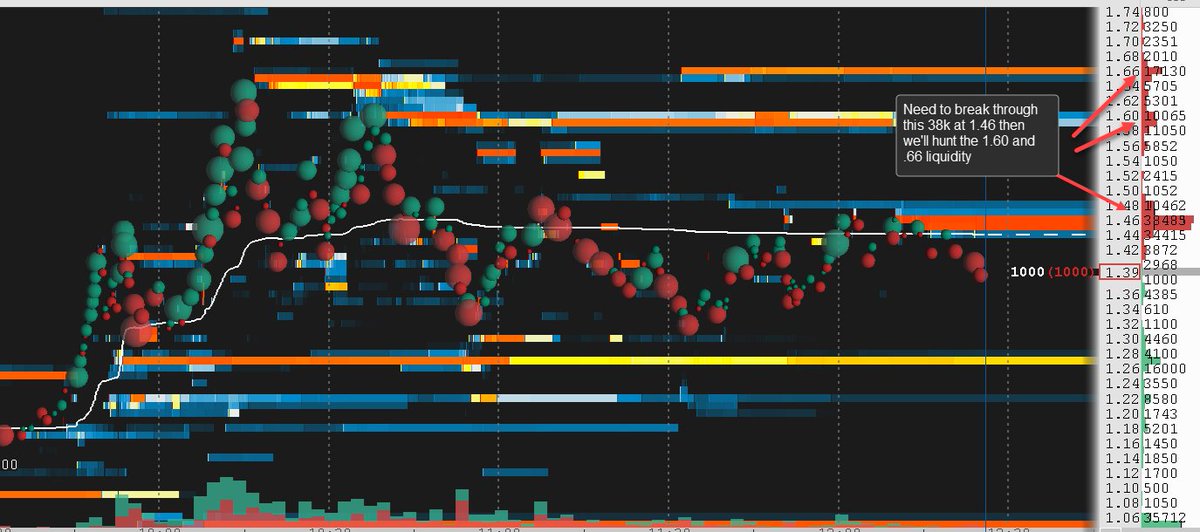
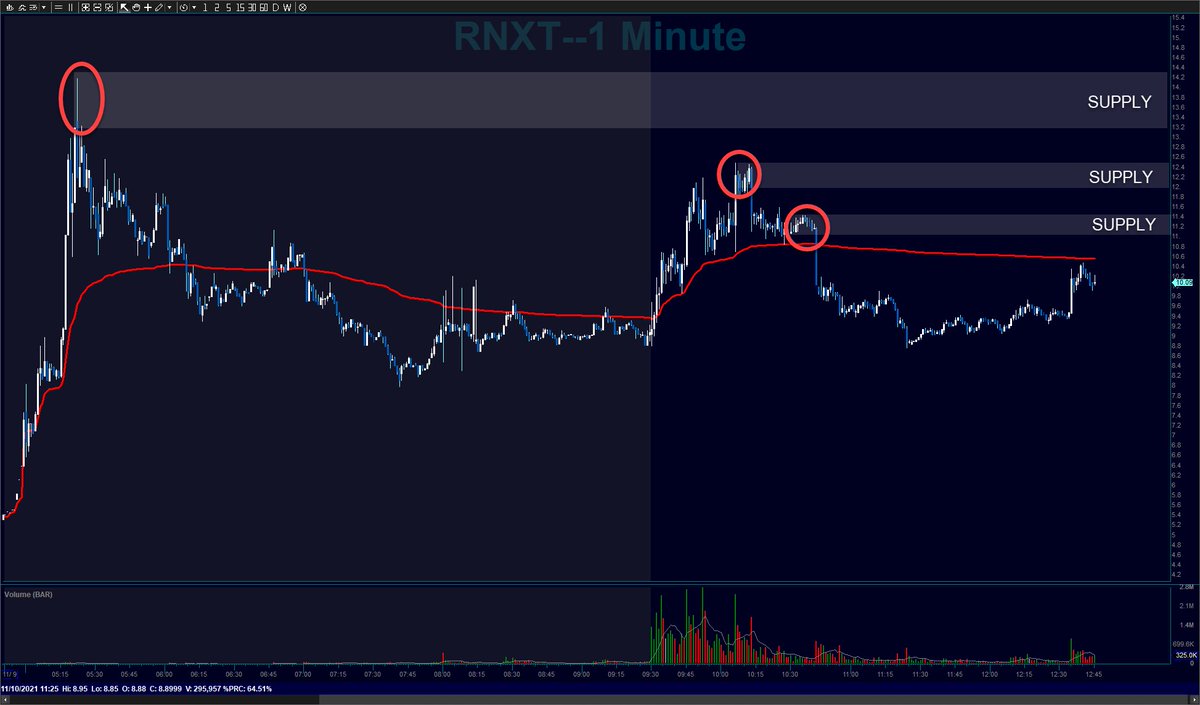
Shelf above HOD = Accumulation....then breaks on flush with increasing volume. Then we see VWAP basing = accumulation...then break on volume pop. VOLUME is key especially at critical levels
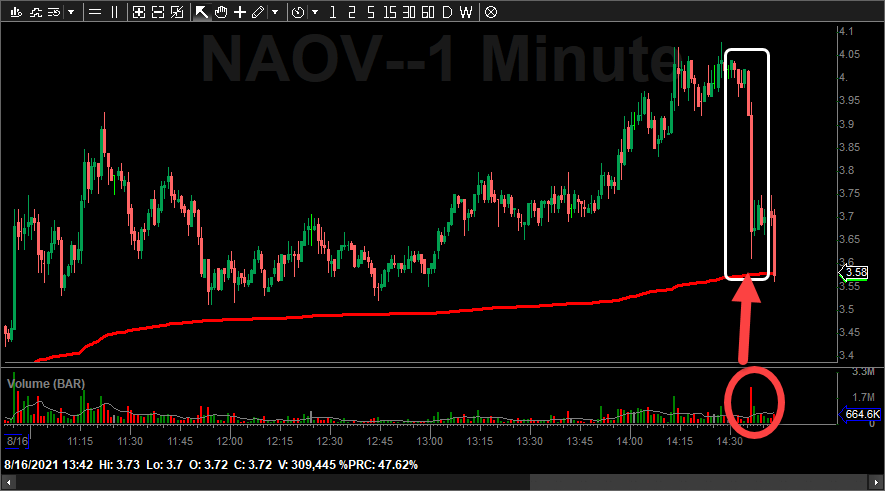
Still early in the day and plenty of rigging could unfold....BUT lots of structure signs are there on NAOV. A High volume (2.3M) flush candle would be nice....just observing
Remember, volume confirms the move....earlier 'flushes' were on lower volume = TRAP, not trend change
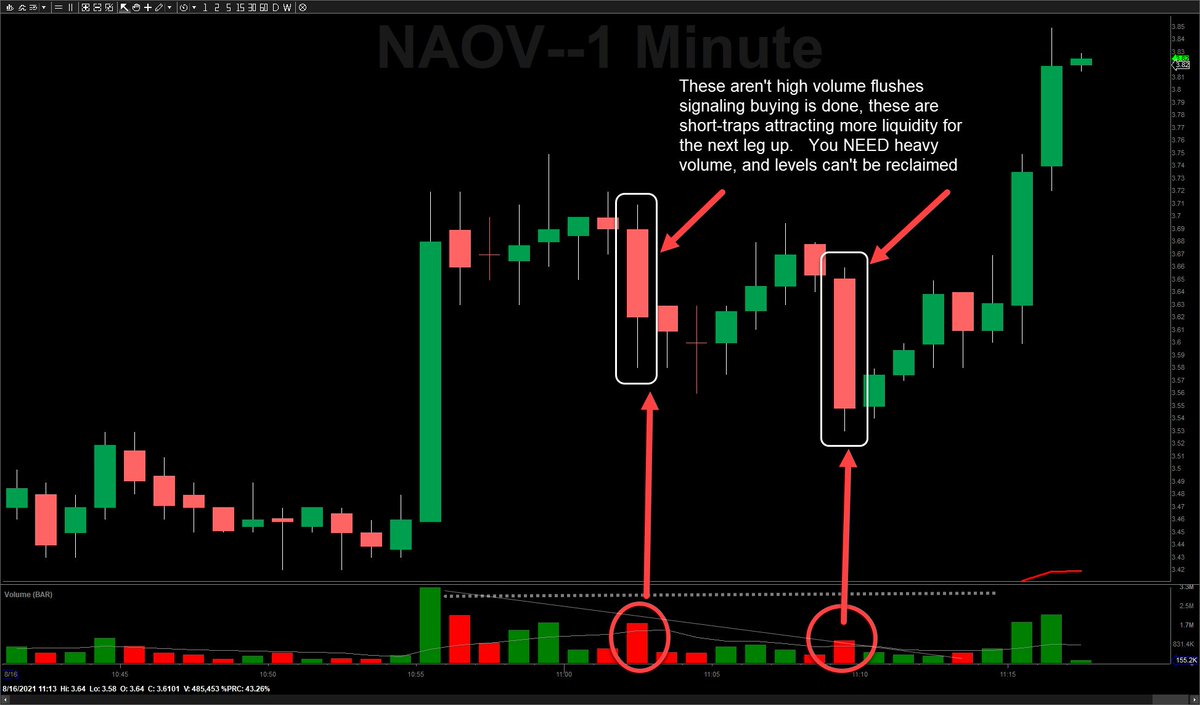
VOLUME on the flushes are key. She's done....
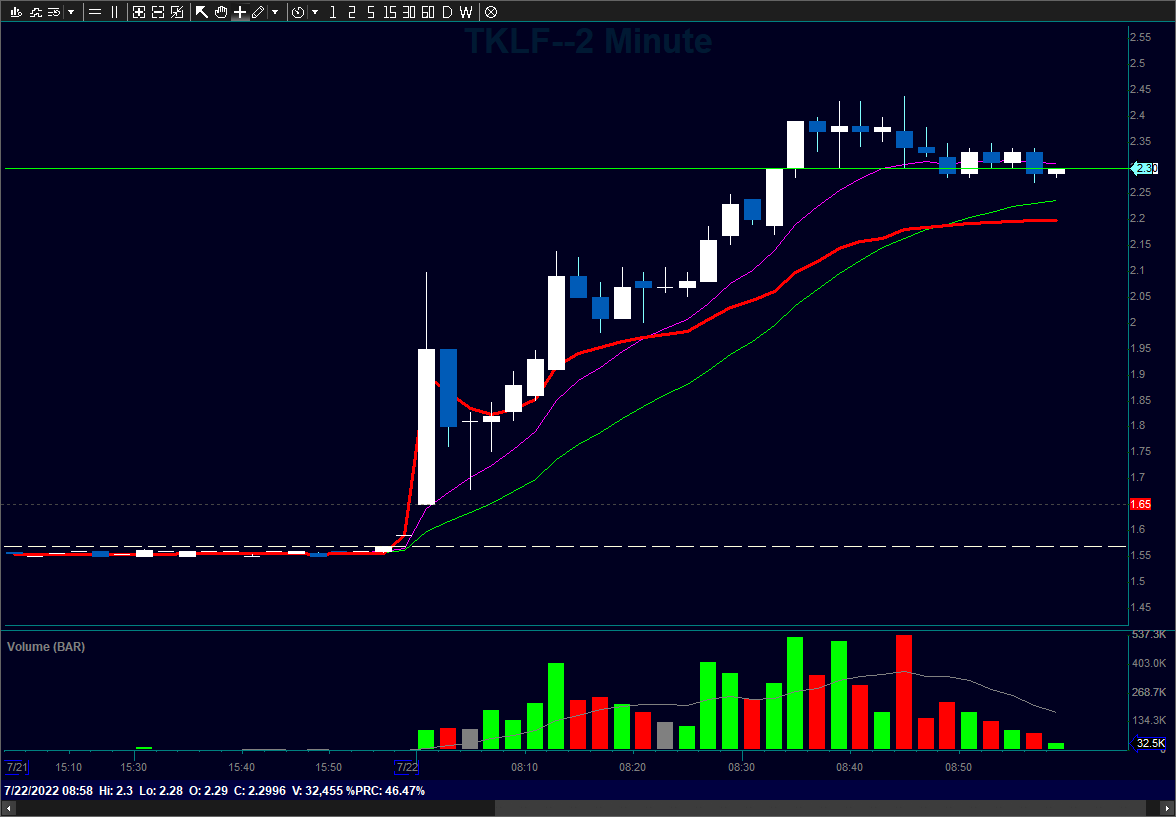
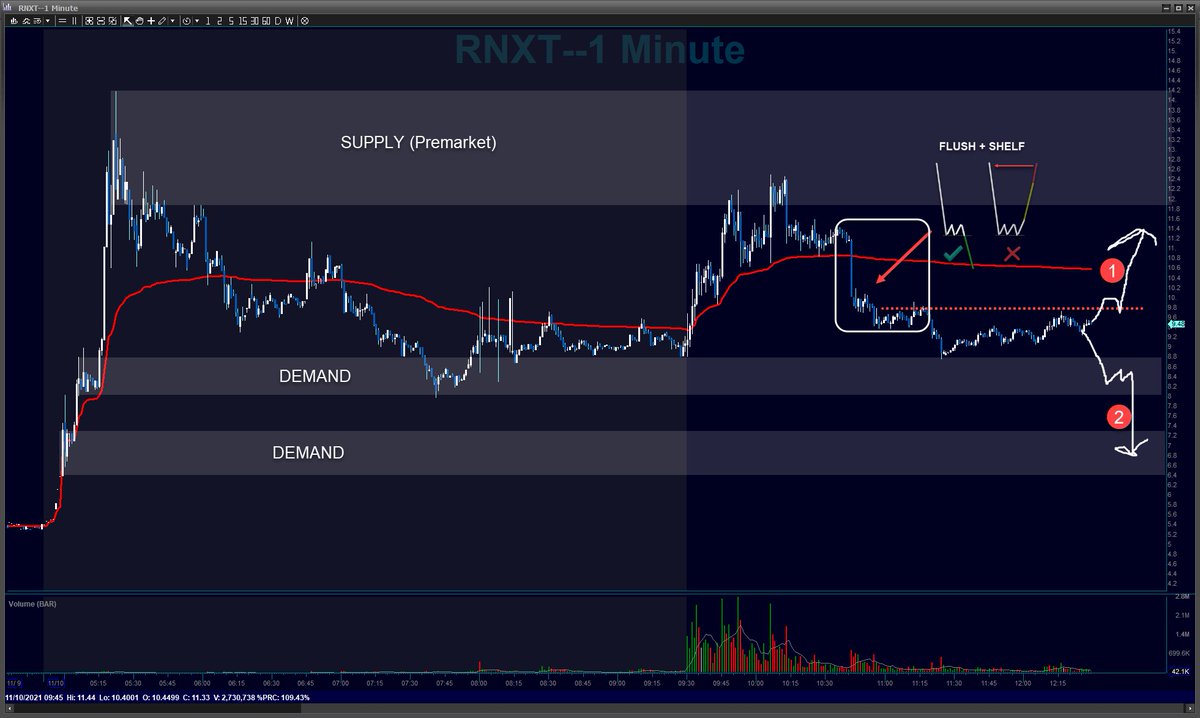
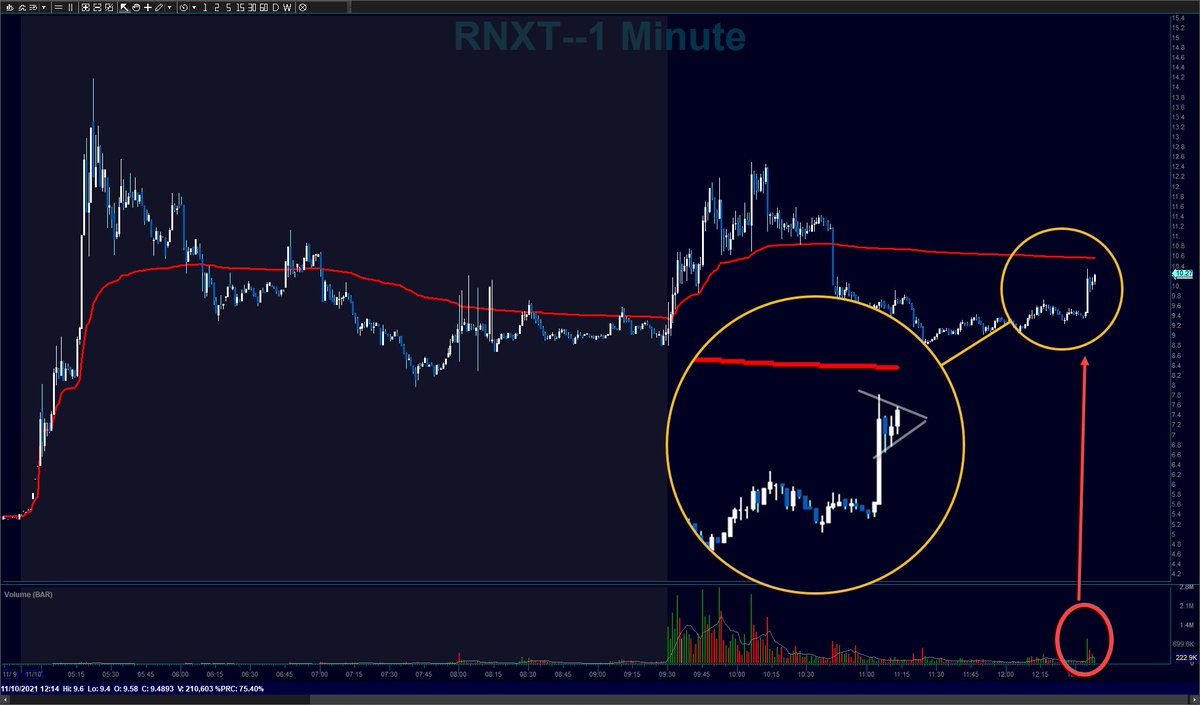
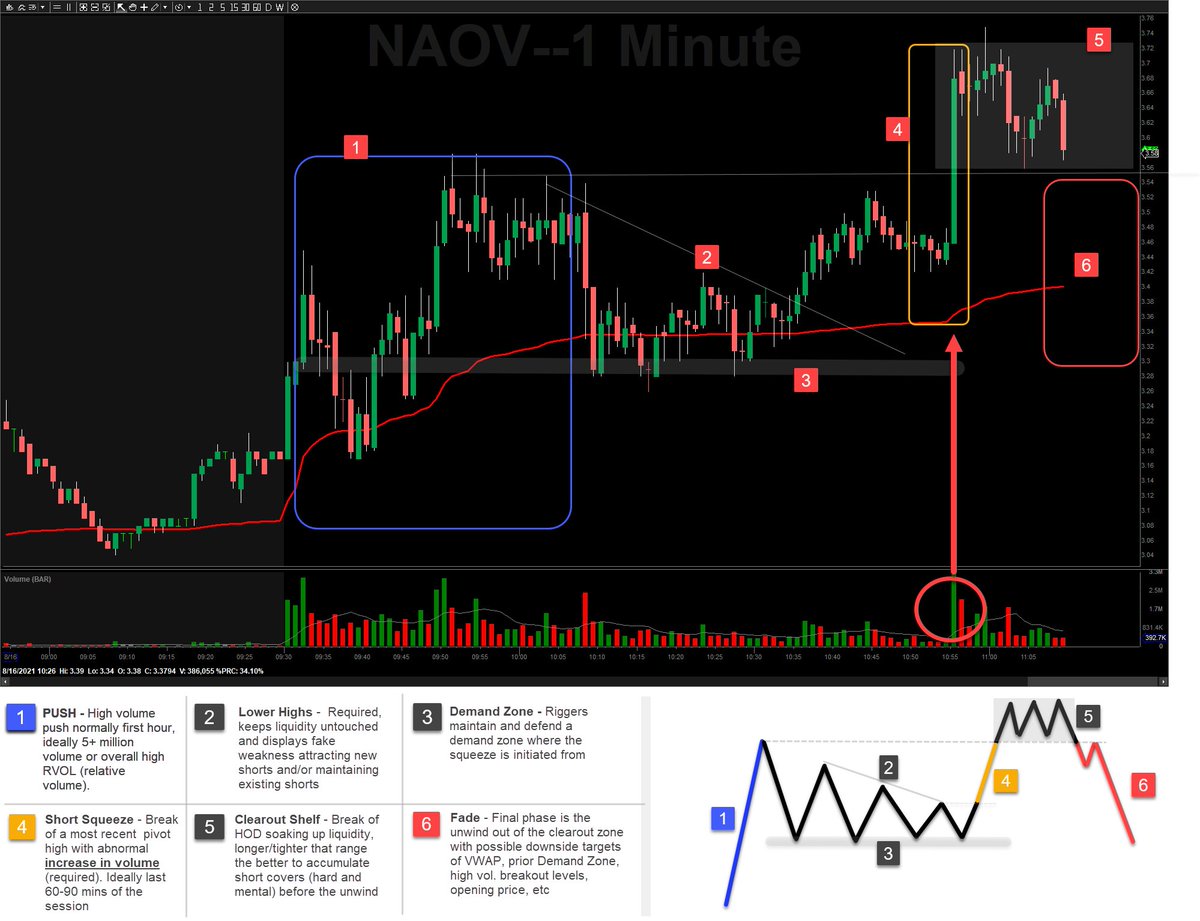
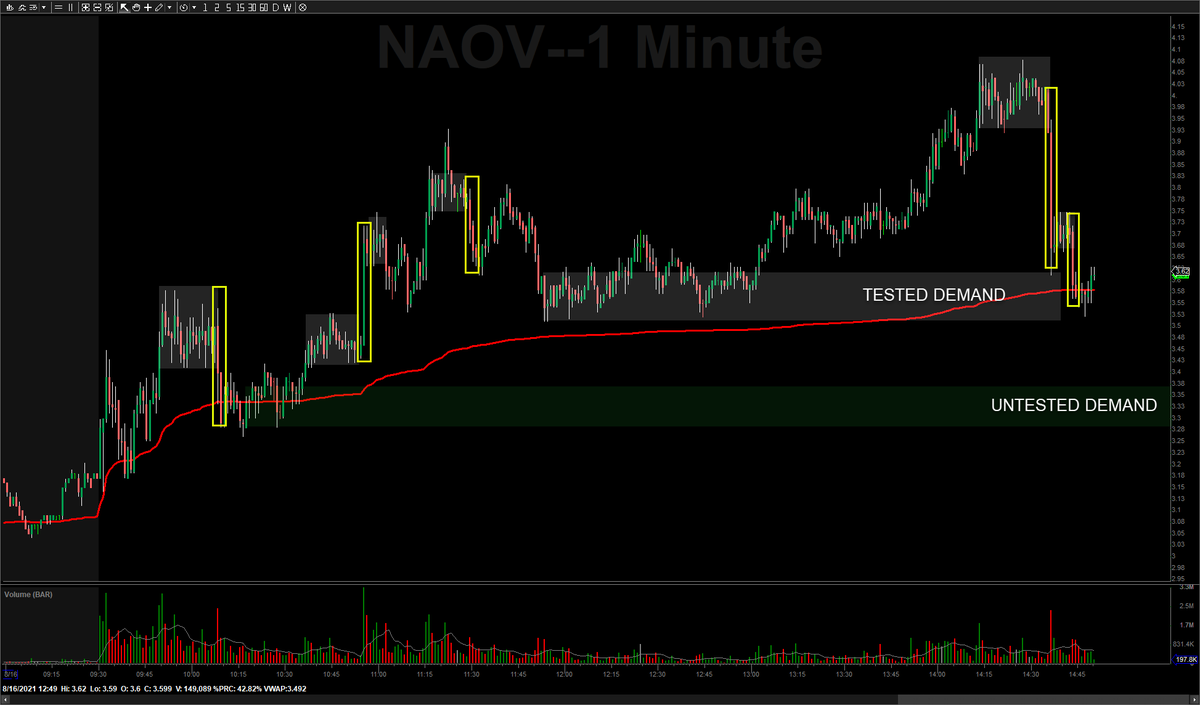
Accumulation (grey boxes) followed by strong moves out (yellow boxes) = rigging...that's not normal price behavior (obviously). Price rotated down to first Demand zone, next target would be green 'untested' Demand in the 3.20-.40 level
• • •
Missing some Tweet in this thread? You can try to
force a refresh
🚨 PM Quiz: $TKLF is top gapper and it's creating a very specific Supply/Demand pattern, and thus a very specific Demand Zone. So 3 questions for you....(1) what pattern is it?, (2) where is the Demand Zone, and most importantly (3) how can you use this to create a plan?
SPOILER (Answers). (1) Pattern is a Rally-Base-Rally, (2) current Demand Zone is that 2.05-2.11 area, and (3) here are a couple of ways you can approach trades....
🚨 Keep an eye on $DDL for testing HOD. It's a larger market cap / float than most rigged names, but it's showing it's structure. It'll need VOLUME soon and can't first break 5.80s Demand. Not trading it but will be watching.
Flags near VWAP = early indications of buying possibly coming in. Watch if flag breaks WITH VOLUME (needs larger than average vol. and sustained over several minutes). LONG: on flag break risking below, target HOD - SHORT: After HOD clearout, then fade. Again, NOT microfloat!!
As expected, volume picking up, sustaining...SQUEEZE timing is perfect and looks to be in the process...targets are most likely overhead Supply and HOD liquidity. Watch volume, it's EVERYTHING
🚨🔥[1/8] In order to understand nuances of a setup, you need to do a "deep dive" and backtest. This thread will give you everything you need to review the Type 1 HOD Clearout structure from @TradetheMatrix1 including examples and content to perform your OWN manual backtest
📈[2/8] BACKGROUND: First you need to understand WHY this structure routinely occures in small/microcaps. Here's the core article. Read it, then re-readit. When your done....read it again.
$REVB - Keep on watch for potential squeeze for HOD clearout. Needs VOLUME and then I'll be looking for this structure
Flagging above VWAP, that's positive sign for the squeeze...the timing and structure is right, now it's all about VOLUME...should happend in the next 2-10 mins if it's going to squeeze)
Need to break the70k resting orders at 1.46/47 then it'll rotate up to 1.60's liquidity. Again, VOLUME IS KEY...otherwise riggers aren't on this anymore and it'll die out
Didn't trade $RNXT, but clear Supply/Demand action happening. If $10 breaks then good chance the $11 flush reclaims. If $9 now breaks, should eat through the tested $8.10-50 Demand and rotate down to the main $7 Demand Zone
Volume picking up, flagging, $10 break....$11 reclaim should be about to happen
Here are the 3 'untested' Supply Zones up above. Supply = Sellers (and since price quickly left these levels, good chance there are unfilled transactions that are waiting to execute). Watch price action at each of these levels *IF* it makes it there...there will be resistance.
🚨QUIZ: Continually asking questions during the trading session is key as the landscape always changes (ex. "if THIS happens, THEN what? Where will I Enter? Exit?). Here are some scenarios that unfolding in my trading/planning and questions I asked...what are your answers?
(1/5) $HUT looks like a strong momentum swing setup. What chart formation do you see to confirm? What other variable is shown that might give you confidence to size up? Where is your stop?
(2/5) This is the premarket price action today on $WATT. Why did I enter where I did? If you would have entered there, where was your stop? and your 2 targets below?