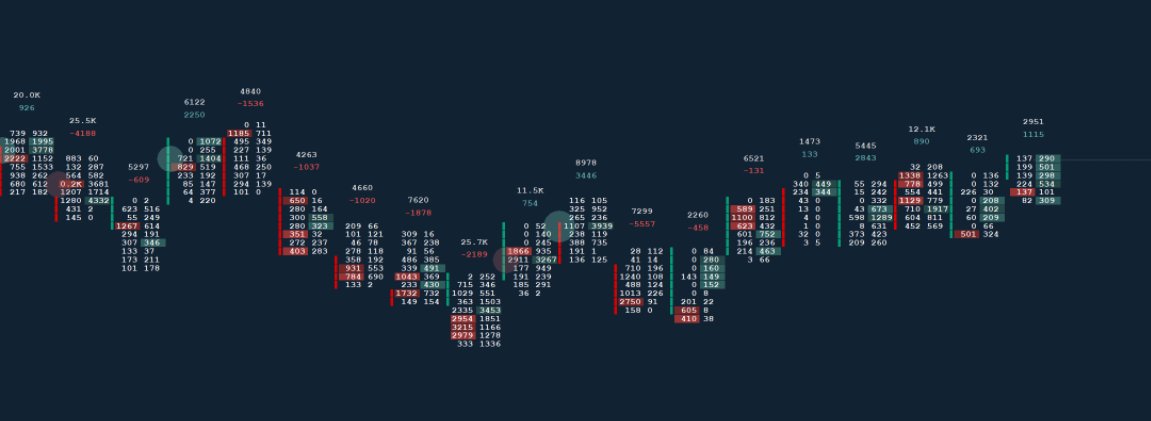
Missed optimal entry for this teaching a friend some delta ladder candles, but we move! Reason for entry shown (arrow), trapped longs on the daily open. Will possibly exit here so I can vibe for the night, will watch charts while coding, waiting for a potential drop. $BTC 🔥
OH YOU THINK MARKET PROFILE WAS FINISHED?
WE BACK!?
Poor Highs/Lows!
Excess!
+ Usability update!
Website: spacemanbtc.com
Indicator: uk.tradingview.com/script/FJnZNVP…
Lets get an update, its been a while ive missed you <3
Lets start with the one thats been needed for a while and finally got released, Poor Highs and Lows (the red),
Poor High/Low points out an unfinished auction which in other words means price is likely to retest this level, in a candle stick this can be seen as a double top/bottom
Here it is in lettering mode, the Poor Highs/Lows identified by the size at the end of the profile, the greater the size the more likely we revist and revisit soon!
Not confident we have bottomed out yet, the positive trapped delta is greater than the delta in the wick of the candle following. Plus hovering below Previous daily low, if i want to long i want us to reclaim both or im not interested. $BTC
Delta print candles + key levels
The downside pressure was siginficant on the candle before the positive delta, to me this indicates a potential that it was a failed bounce first perhaps another sweep of the low coming
The NPOC on the Daily Market Profile is what im watching, not interested much today will focus on finishing MP code instead 🔥 $BTC
OH YOU KNOW WHAT TIME IT IS.
FOOTPRINT CANDLES SPACEMANBTC 🤯
Indicator: uk.tradingview.com/script/HfEn4mY…
Website to join: spacemanbtc.com
Left is my work, right is the inspiration by my friend @abetrade
A thread, pay attention class is in session 🤓👨💻
@abetrade
Lets start this one right, if you want a full step by step breakdown watch this video (text gets bigger), it shows the perfection of using this properly for traps, and how ive used it recently. Beautiful trades on this one lets fucking go!
Lets start with the idea for how I was able to take the trade i took yesterday, you can see here the difference in momentum with buyers weakening a strong loss of a level with big selling highlighting the likeliness of a trap, explaining here with delta for ease of reading!
Sometimes draw a line and use delta ladder candles to see late longers. +rsi 5 min div, thats my execution style.
I do still use MP but working on testing the delta ladder candles some more so its my focus for now! Will be combining my indis together at some point to make algos 👍 Current weekly MP you can see below as its what im paying attention to to consider building a long at the MO.
OOF LATE NIGHT UPDATE ARE YOU FUCKING READY!?
DELTA LADDER CANDLES, Delta Spread VPOC!?
Identify the dumb people in a trade made easy
Indicator: uk.tradingview.com/script/qgpxEza…
Get access here: Spacemanbtc.com
Small Thread
In the process of making a new indicator, I realised something that I could do to provide some more easy to read alpha!
Heres the explanation, by highlighting the Delta VPOC, e.g. highest bids > ask, the trader is able to more easily determine where traders are stepping in
For the above, its apparent in the wick that the traders are longing wicks, as opposed to bottoms, towards a very obvious decision point high, 47k region. This could indicate trapped buyers and a swift down move to take them out of positions!
I actually caught this trade before
MARKET PROFILE OVERLAY FREEEE
F
R
E
E
We are live again, like and retweet we need to reach everyon who may have missed it! uk.tradingview.com/script/h9e7Ilp…