Suomen epidemia 17.8.2021: tartuntojen määrä laskee, mutta alle 15-vuotiaiden saamien tartuntojen määrä on noussut koko 4. aallon korkeimmalle tasolle. Positiivisten osuus nousee, eli tartuntojen määrä vähenee testien lukumäärän pienentyessä. 1/x
Tänään THL ilmoitti 665 tartuntaa, ei poistanut yhtään, ja otti kiinni viivettä 59 tartunnan verran. Muuttumattomalla viiveellä laskettu uusien tartuntojen määrä = 665+0-59=606 (punainen viiva). 2/x
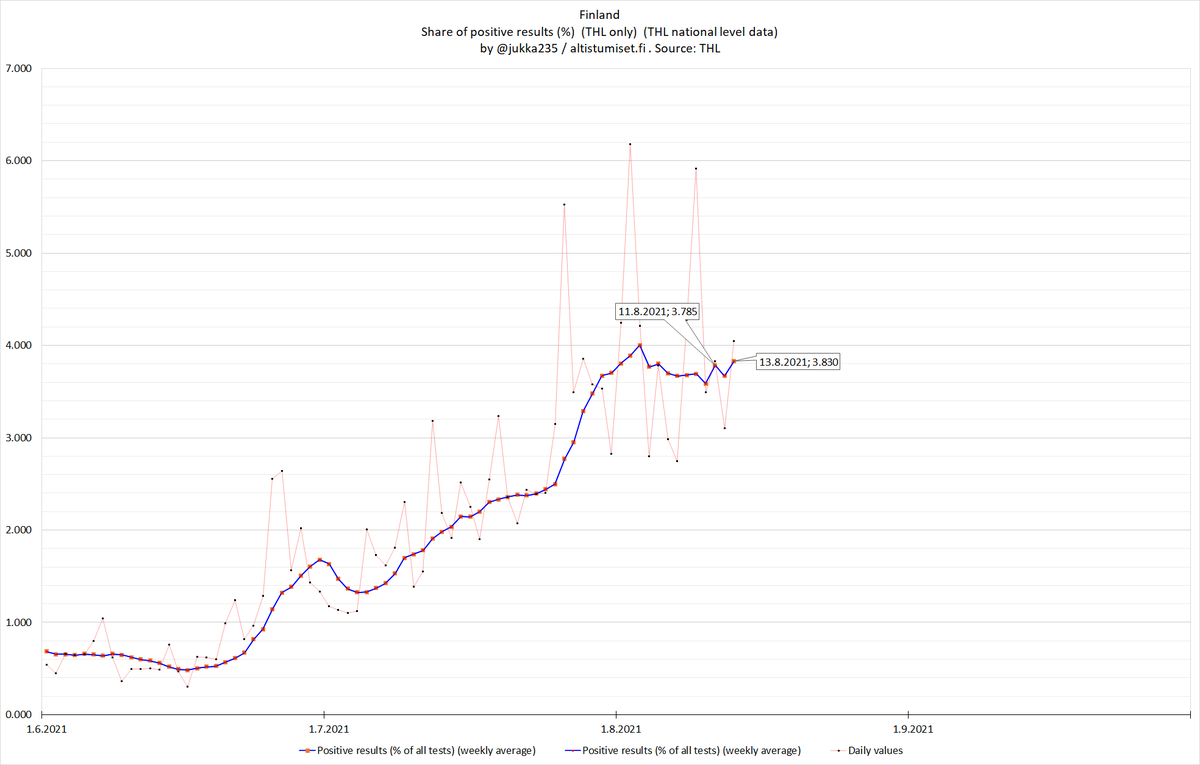
Positiivisten osuus on noussut 0.6 prosenttia päivässä viimeisen kahden päivän aikana. Testauksen vähetessä tartuntoja jää enemmän piiloon. 3/x
Testien määrä vähenee edelleen. 4/x
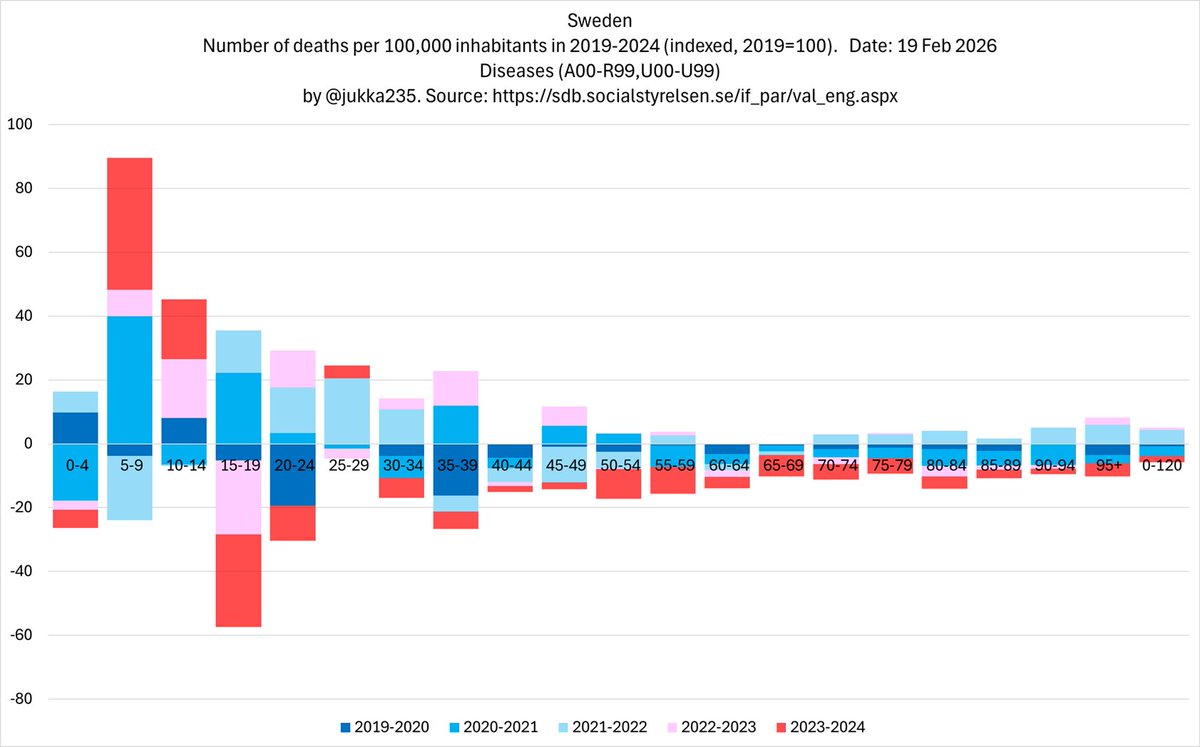
15-29 -vuotiaiden ilmaantuvuus pienenee, mutta suurimmaksi osaksi rokottamattomien 10-14 -vuotiaiden ja täysin rokottamatta olevien 0-9 -vuotiaiden ilmaantuvuus nousee edelleen. 5/x
Viimeisen kuukauden aikana yli 75-vuotiaiden tartunnat ovat kasvaneet kaikkein nopeinta vauhtia, jopa nopeammin kuin alle 20-vuotiaiden tartunnat. Epidemian hidastuminen ei koske yli 75-vuotiaita, joista osa on edelleen kokonaan rokottamatta. 6/x
Eli jos oli tarkoitus suojata lapset ja vanhukset, niin nyt on käynyt juuri päinvastoin. 7/x
Neljän koulupäivän aikana (11.8-16.8.) kouluissa ja päiväkodeissa tapahtuneiden altistumisten määrä on noussut jo korkeammalle kuin viime vappuna. Tartunnat löytyvät itämisajan jälkeen eli noin viisi päivää myöhemmin. Tarkat paikat: altistumiset.fi 8/x
Mortality in Sweden: Are the causes of death that are increasing among 0-4, 5-9 and 10-14 year olds also rising in older age groups?
Let's find out. 1/x
These causes collectively represent all causes of death that are rising among 0-4, 5-9 and 10-14 year olds. Among 0-4 year olds, their average growth rate (2019-2024) is 13.5%. 2/x
Among 5-9 year olds the average annual growth rate (2019-2024) is 33.8 percent (10-fold in 7.9 years if this growth rate continues). 3/x
Among 0-4 year olds, the 19 causes of death with the highest growth (2004 compared with the 1997-2019 average) have increased since 2019 at an average rate of 51% per year. 2/x
Among 0-4 year olds, adding the next 18 causes brings the total to the top 37 fastest growing causes of death. Together, these have increased since 2019 at an average rate of 24.6% per year, compared with just 0.6% per year during 1997-2019. 3/x
Here are the 19 leading causes of death among 10-14 year olds, ranked by their 2024 incidence compared to the 1997-2019 average. Together, they account for 35% of all deaths in 2024. 2/x
Here are the next 18 diseases. Combined, these causes represent 60% of all deaths in 2024, and have an average growth rate of 33.7% per year between 2019 and 2024 (10 times in 7.9 years). 3/x
Between 2020 and 2025e, patient growth is nearly uniform across all age groups above one year of age. However, growth among those aged 1-64 clearly exceeds that observed in older age groups. 2/x
Situation by disease group (nervous system diseases G00-G99):
- fastest growth (2020–2025e): Other disorders of the nervous system (G90–G99), 15.9% average annual growth
- fastest growth (2024-2025e): Inflammatory diseases of the central nervous system (G00–G09), 19.7% 3/x
After more than five years of silence, mainstream media has begun to acknowledge that C19 can harm T cells, and to discuss the consequences that follow. @fitterhappierAJ was one of the first, if not the first, to talk about this. 1/x
Dr. Leonardi has provided a significant amount of direction for me. In particular, he has been interviewed in some excellent articles that have withstood the test of time. Here is one of them. 2/x
We have seen it all.
- in 2020, they said that our health systems are so robust that this disease wouldn't come here
- then they wanted them infected. C19 was de facto allowed to spread in schools. Only a small fraction of <12 year olds received ... 3/x
Something is causing injuries among young children. 1/x
Something changed in 2022. Before that, the numbers were generally falling. Wonder what it could be. 2/x
After 2022, 1-6 year olds have overtaken a total of three other age groups (50-64, 15-24 and 65-74 year olds), and are now clearly above the total population average. All injuries (S00-S99). 3/x