Visuals in the latest #IPCCReport are a marvel I cannot stop talking about!
Here's part 2 of my overview of @IPCC_CH AR6 SPM visuals.
Kudos once again to @angelamorelli @tomhal99 @jordanharold and @MelichatGo for helping to visualize our insights (1/n)
Here's part 2 of my overview of @IPCC_CH AR6 SPM visuals.
Kudos once again to @angelamorelli @tomhal99 @jordanharold and @MelichatGo for helping to visualize our insights (1/n)

After yesterday, we now landed on changes in extremes🌡️⛈️🥵🧺!
And although I don't like to pick favorites, I do like this visual very much.
Too big for a single tweet, this one shows how hot extremes over land change compared to when our great-grandparents were alive. (2/n)
And although I don't like to pick favorites, I do like this visual very much.
Too big for a single tweet, this one shows how hot extremes over land change compared to when our great-grandparents were alive. (2/n)

Did you notice in the previous figure: a heat extreme that our great-grandparents would have experienced once in their lifetime, will occur about once every 4 years in a 2°C warmer world. It will be the norm in a 4°C warmer world.
I like the clarity of this figure! :)
(3/n)
I like the clarity of this figure! :)
(3/n)
The second part of the figure shows similar changes for extreme precipitation and its antipode, drought.
Less explicit as for heat extremes, but still impressive (4/n)
Less explicit as for heat extremes, but still impressive (4/n)

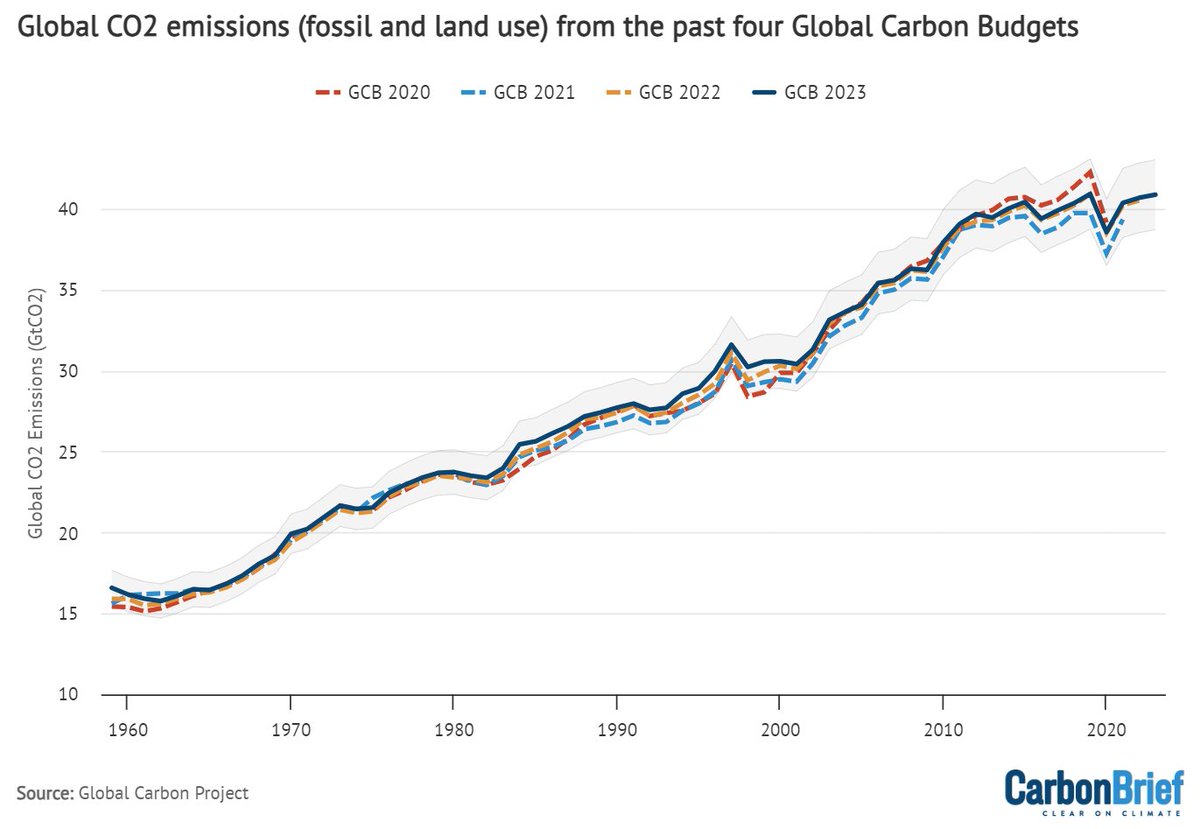
Figure SPM.7 is also a beauty with a powerful message.
Land and ocean carbon sinks take up a smaller proportion of CO2 emissions when we emit more CO2.
(5/n)
Land and ocean carbon sinks take up a smaller proportion of CO2 emissions when we emit more CO2.
(5/n)

As long as we increase emissions, the land and oceans will take up more CO2. This sounds like good news, but the bad news is in the donuts at the bottom that show that in relative terms sinks become weaker the more CO2 we emit and more CO2 remains in the atmosphere. (6/n)
The 8th figure then shows how components of our planet can respond very differently to global warming (panel a).
(7/n)
(7/n)

Arctic sea ice and ocean acidification (panels b and c) move almost in lock step with global warming and CO2 concentrations.
Global sea level rise is sluggish to respond (panel d) and continues to change for centuries once we give it a global warming push (panel e). (8/n)
Global sea level rise is sluggish to respond (panel d) and continues to change for centuries once we give it a global warming push (panel e). (8/n)
The second-to-last figure shows that climate change as it can be experienced by you and me (that is, extreme heat, coastal erosion, river flooding, ... there's a long list) are projected to change in all regions around the globe.
There no place to hide from #GlobalWarming
(9/n)
There no place to hide from #GlobalWarming
(9/n)

And finally, last but not least, the 10th figure of the @IPCC_CH SPM tells us that every tonne of CO2 emissions adds to global warming.
It did so in the past (grey features on the left)
It will do so in the future (coloured ranges on the right)
(10/n)
It did so in the past (grey features on the left)
It will do so in the future (coloured ranges on the right)
(10/n)

How successful we will be in bringing global greenhouse gas emissions down by 2050 will determine whether we keep warming to 1.5°C or will then already suffer from a 2.5°C warmer planet.
(end)
(end)
As usual, if you want to read more: check out the @IPCC_CH AR6 WG1 report website
ipcc.ch/report/ar6/wg1/
ipcc.ch/report/ar6/wg1/
• • •
Missing some Tweet in this thread? You can try to
force a refresh