
Latest results from the #COVID19 Infection Survey show a mixed picture across the UK.
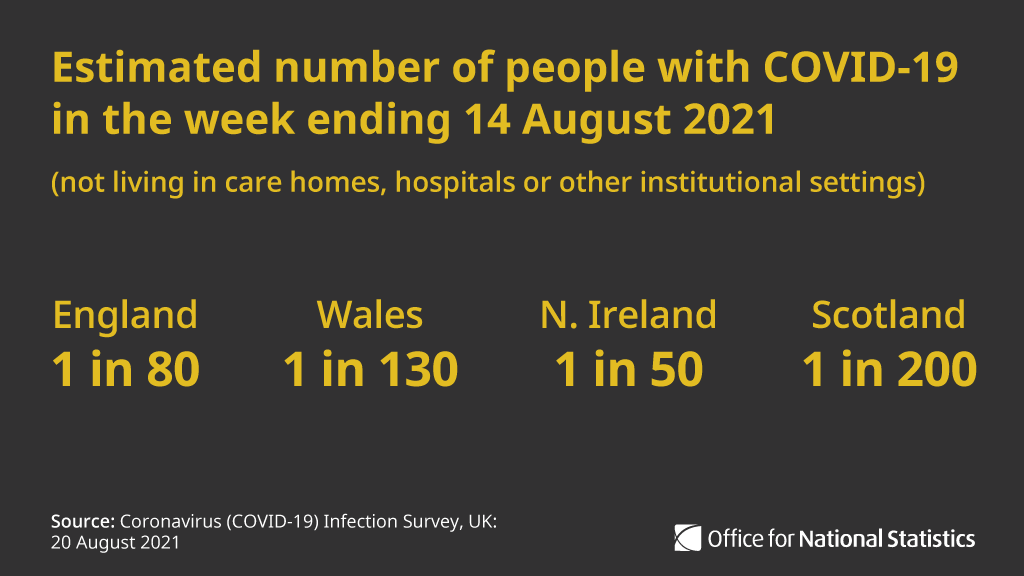
Decreases were seen in England and Scotland in the week ending 14 August 2021, while there was an increase in Wales.
The trend for Northern Ireland was uncertain
ow.ly/73KR50FUNmy
Decreases were seen in England and Scotland in the week ending 14 August 2021, while there was an increase in Wales.
The trend for Northern Ireland was uncertain
ow.ly/73KR50FUNmy
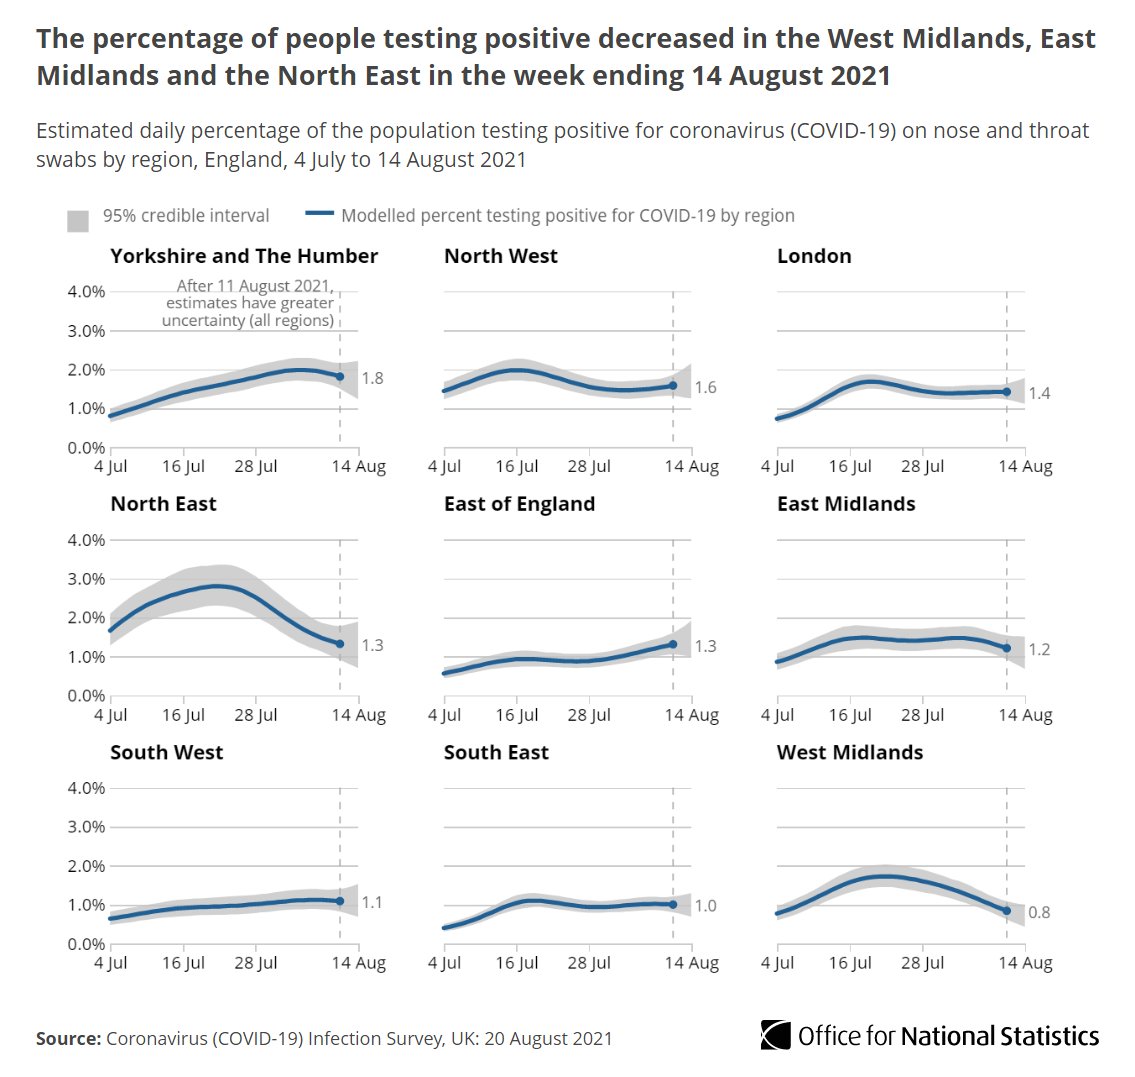
The #COVID19 infection rates in England in the week ending 14 August 2021 decreased in
▪️ the West Midlands
▪️ the East Midlands
▪️ the North East
➡️ ow.ly/1IFr50FUNq9
▪️ the West Midlands
▪️ the East Midlands
▪️ the North East
➡️ ow.ly/1IFr50FUNq9
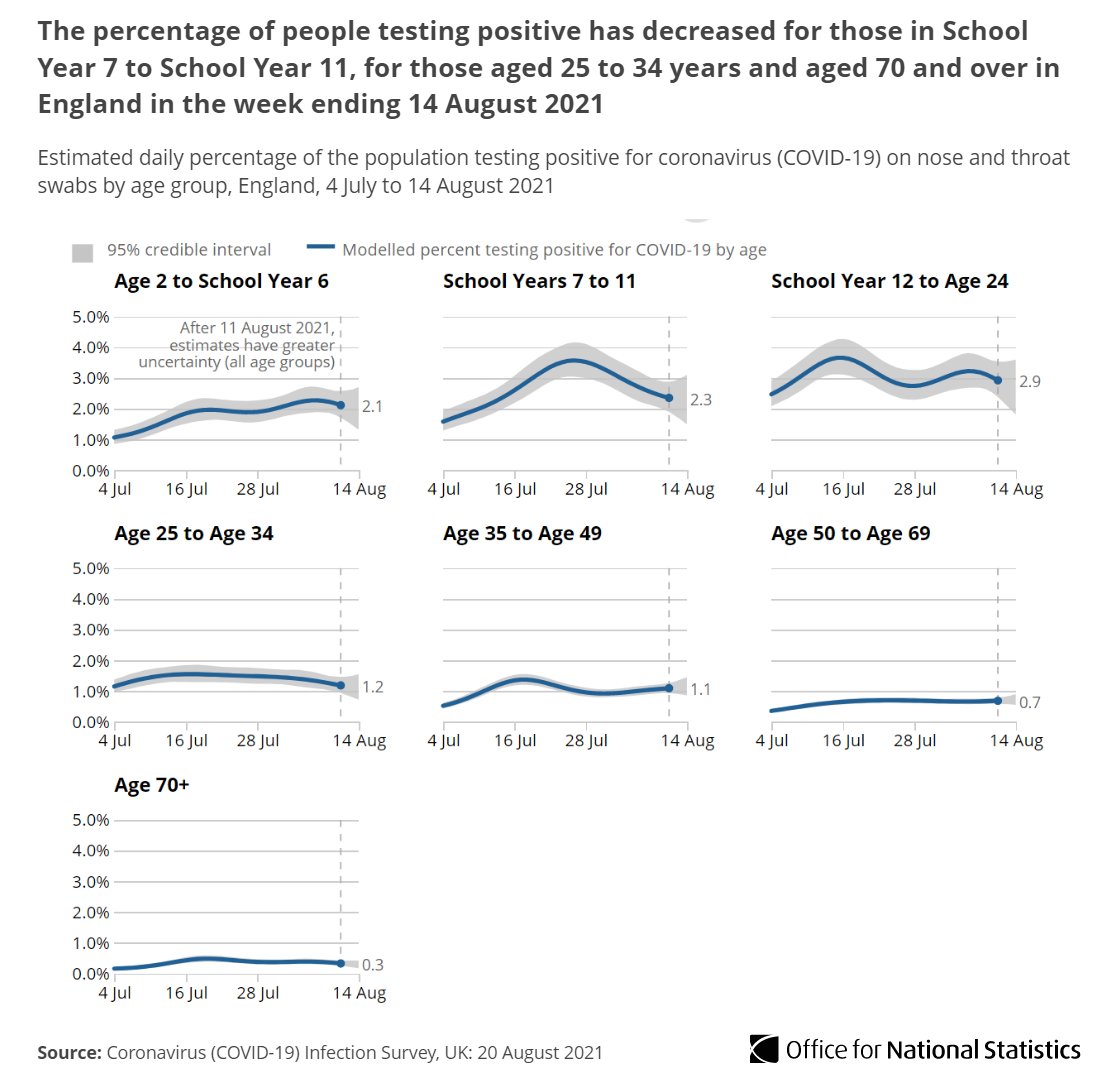
The percentage testing positive in England fell in the week ending 14 August 2021 for people
▪️ in School Years 7 to 11
▪️ aged 25-34
▪️ aged 70+.
Infection rates increased in the 35-49 age group, while the trend in all other age groups was uncertain ow.ly/csIB50FUNs1
▪️ in School Years 7 to 11
▪️ aged 25-34
▪️ aged 70+.
Infection rates increased in the 35-49 age group, while the trend in all other age groups was uncertain ow.ly/csIB50FUNs1
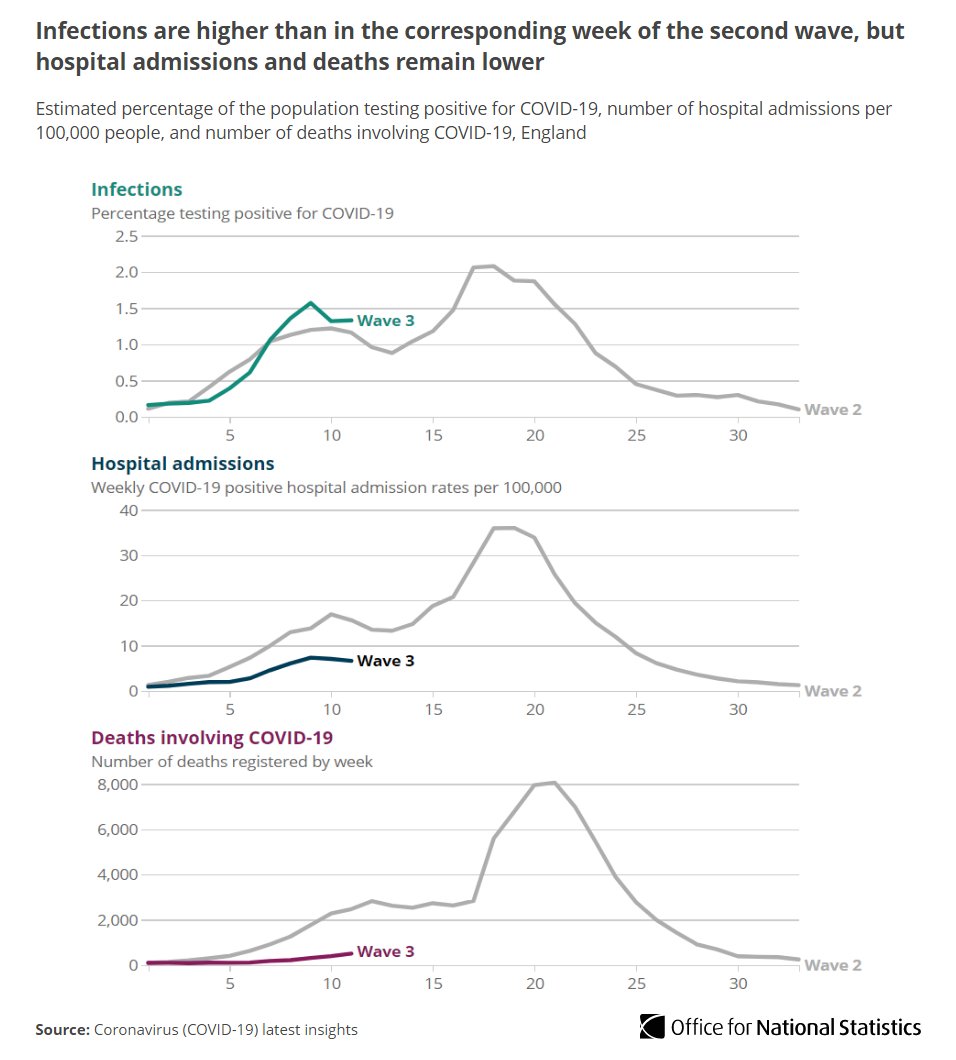
Commenting on today’s results, Kara Steel, Senior Statistician for the #COVID19 Infection Survey, said:
#COVID19 infections in the week ending 14 August 2021 continued to be higher than the corresponding week in the second wave (end of November 2020) in England.
However, hospital admissions and deaths remain lower ow.ly/gdWm50FUNR0
However, hospital admissions and deaths remain lower ow.ly/gdWm50FUNR0
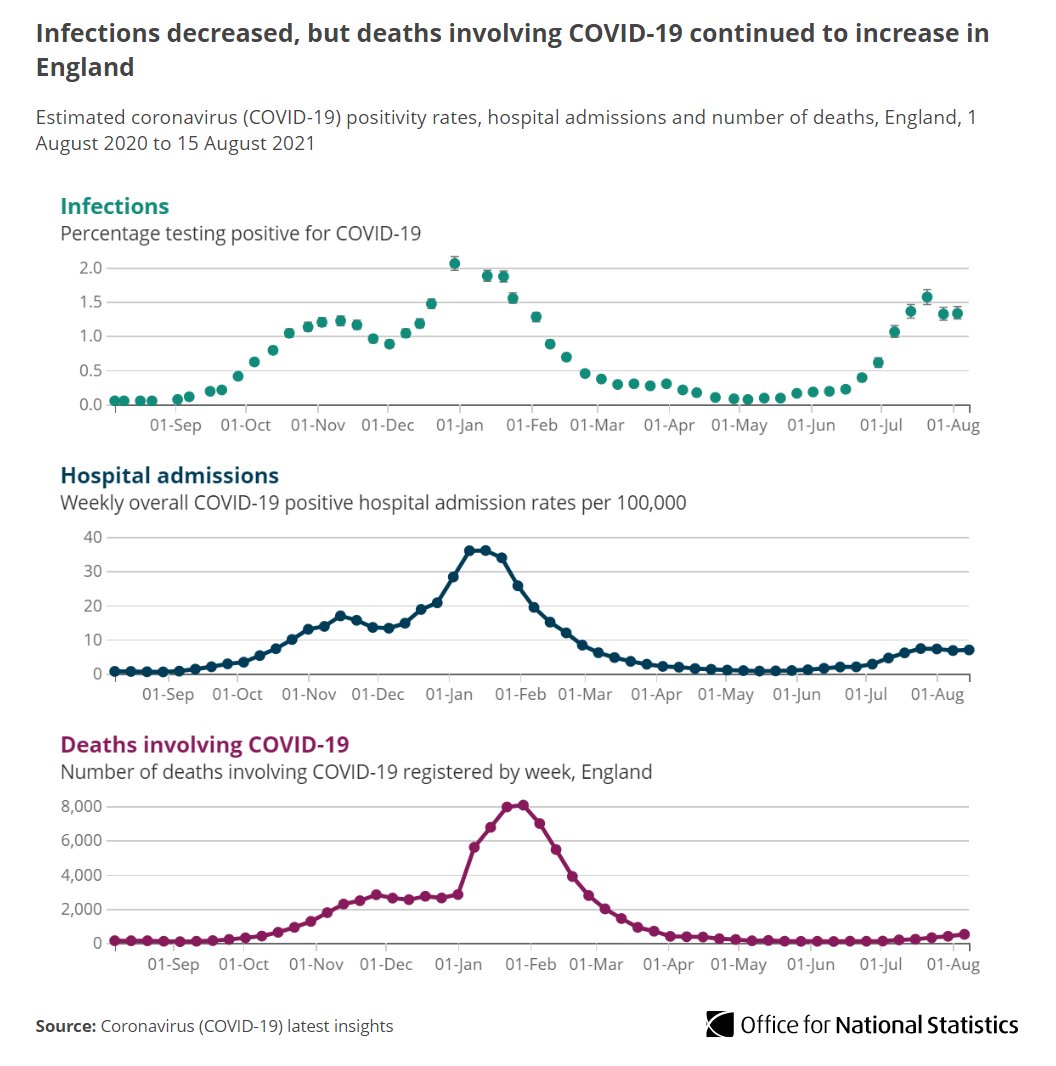
In England, #COVID19 infections decreased in the latest week.
However, deaths involving COVID-19 continued to increase ow.ly/CC8m50FUNYk
However, deaths involving COVID-19 continued to increase ow.ly/CC8m50FUNYk
• • •
Missing some Tweet in this thread? You can try to
force a refresh


