MASTER-CLASS ON HEATMAPS.
Heatmap allows to see ACTUAL Supply and Demand.
People find it really scary. This is a thread to understand Heatmaps.
Please Share and learn.💯
A THREAD.
Heatmap allows to see ACTUAL Supply and Demand.
People find it really scary. This is a thread to understand Heatmaps.
Please Share and learn.💯
A THREAD.
Before we learn about heatmaps, let's clear some basics about.
1. Types of orders.
2. Order Flow.
3. Auction Process.
P.S. Tweet number 8th is my favourite.
1. Types of orders.
2. Order Flow.
3. Auction Process.
P.S. Tweet number 8th is my favourite.
Order-flow introduction for Dummies.
Order Flow Analysis is said to have an edge because
1. There is little guessing involved.
2. You clearly see where the orders are.
However, it doesn't mean it is the best system.
Use what works for you.
Order Flow Analysis is said to have an edge because
1. There is little guessing involved.
2. You clearly see where the orders are.
However, it doesn't mean it is the best system.
Use what works for you.
There are 2 kinds of primary orders.
Market Order- Orders get filled at whatever the latest price is.
Limit Order- Orders get executed at the price mentioned in the order.
Market Order- Orders get filled at whatever the latest price is.
Limit Order- Orders get executed at the price mentioned in the order.

Based on the above,
There are 2 kinds of Market Participants.
Aggressive and Passive.
The Aggressive Participants rely on Market Buys and Sells.
The Passive Participants rely on limit buy and sell.
Also, Whales GENERALLY use limit orders*
There are 2 kinds of Market Participants.
Aggressive and Passive.
The Aggressive Participants rely on Market Buys and Sells.
The Passive Participants rely on limit buy and sell.
Also, Whales GENERALLY use limit orders*
The Aggressive participants, i.e. The participants using on marketorder depend on the limit orders in the Order-Book for their orders to be filled.
To re-iterate, Passive Participants are building walls of orders that the Aggressive Participants try to eat through.
Understood?
To re-iterate, Passive Participants are building walls of orders that the Aggressive Participants try to eat through.
Understood?
The Market orders are matched against the orderbook and executed.
Limit orders make up the order book.
Hence, Aggressive Traders, i.e. The people who market buy or sell are taking liquidity away from the market and hence called market Taker.
All orders in the books are limit.
Limit orders make up the order book.
Hence, Aggressive Traders, i.e. The people who market buy or sell are taking liquidity away from the market and hence called market Taker.
All orders in the books are limit.

Limit Orders or the passive players are adding liquidity to the market, hence limit orders are also called Maker Orders.
It should be clear by not that Limit orders are Market Makers.
They decide the amount or supply and demand at a price point.
Limit orders= Price control.
It should be clear by not that Limit orders are Market Makers.
They decide the amount or supply and demand at a price point.
Limit orders= Price control.

Remember.
1. Price going up is looking for sellers.
2. Price going down is looking for buyers.
3. Price in equilibrium leads to ranging.
4. There is rarely an agreement about the price in the market.
Use the tools with Price action as described here t.me/EmperorbtcTA/4…
1. Price going up is looking for sellers.
2. Price going down is looking for buyers.
3. Price in equilibrium leads to ranging.
4. There is rarely an agreement about the price in the market.
Use the tools with Price action as described here t.me/EmperorbtcTA/4…
HEATMAPS.
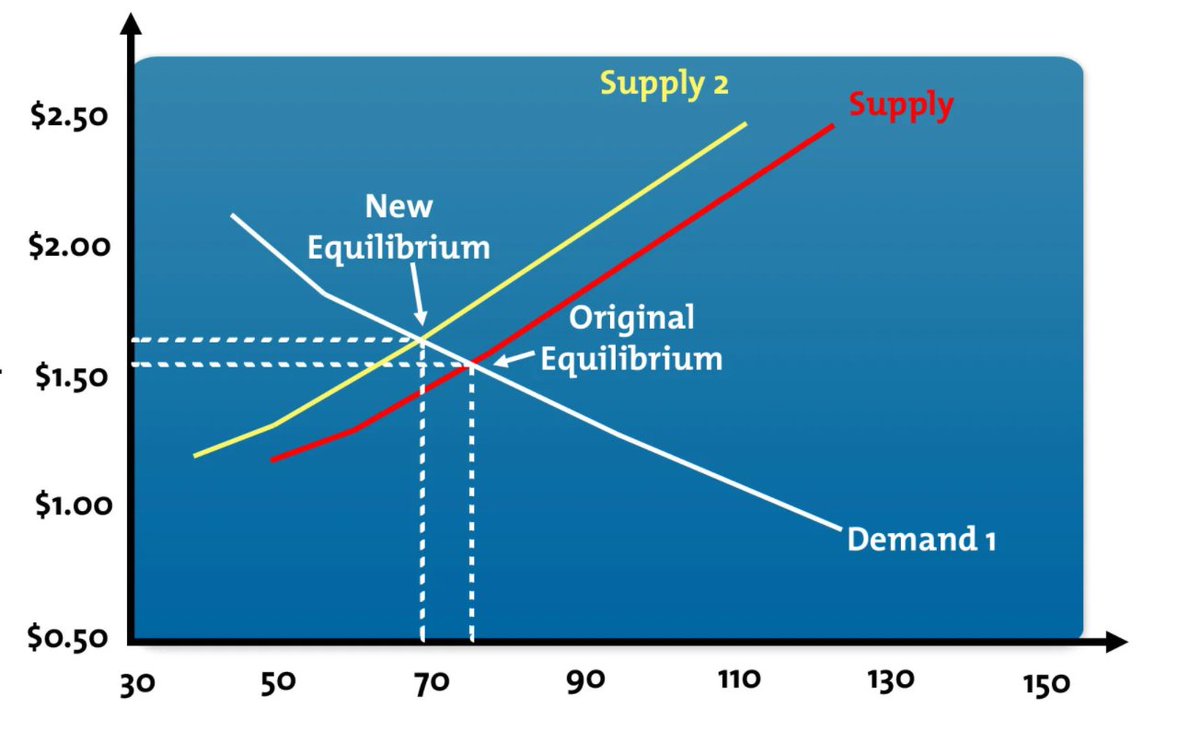
In markets, Forex, Crypto or cattle trade, price is determined by only one thing:
Demand and supply pressure. Willingness to buy/sell at a certain price.
Simple as that. Everything else, all other tools are just reliant on the above or a derivative of it.
In markets, Forex, Crypto or cattle trade, price is determined by only one thing:
Demand and supply pressure. Willingness to buy/sell at a certain price.
Simple as that. Everything else, all other tools are just reliant on the above or a derivative of it.
Order Flow lets you see the bids/asks factors that drives price.
That’s why it’s so powerful. And it’s easier to learn than you might think.
We will learn how to do it through Heatmaps, which are visual representations of Buy and Sell Orders.
That’s why it’s so powerful. And it’s easier to learn than you might think.
We will learn how to do it through Heatmaps, which are visual representations of Buy and Sell Orders.
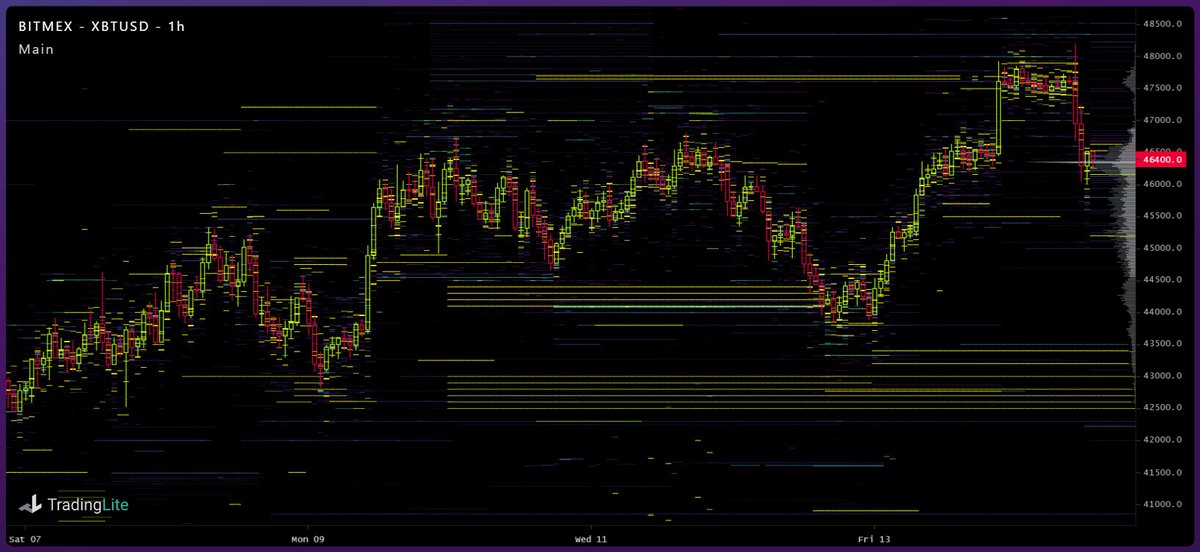
Here’s what it looks like tradinglite. I am in no way associated with it tradinglite.
It contains a regular candlestick chart, plus all the limit orders.
Every horizontal line is an order, and the brighter the color, the larger the size of the order.
It contains a regular candlestick chart, plus all the limit orders.
Every horizontal line is an order, and the brighter the color, the larger the size of the order.

The bars at the top let you adjust the order size that will be visible.
The left bar adjusts the size of the smaller orders and the right bar adjusts the size of the bigger orders.
Use what favours you.
The left bar adjusts the size of the smaller orders and the right bar adjusts the size of the bigger orders.
Use what favours you.

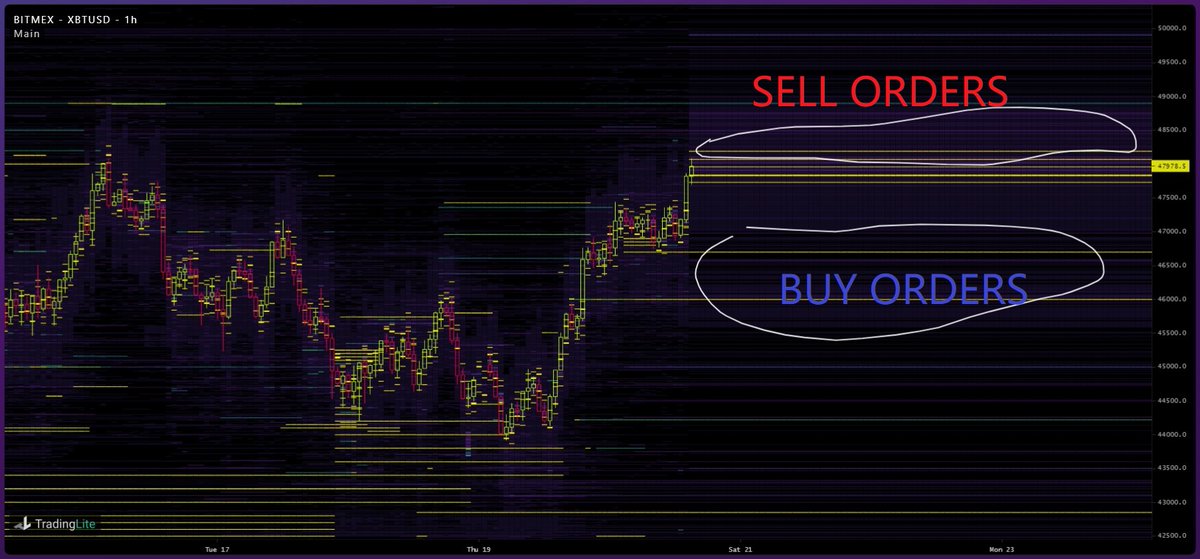
So what does that tell you?
It’s simple. If there’s a lot of orders at a specific price, that means whales want to buy (lines below price) or sell (lines above price) at that level.
The larger the orders, the harder it is for the price to move through them.
It’s simple. If there’s a lot of orders at a specific price, that means whales want to buy (lines below price) or sell (lines above price) at that level.
The larger the orders, the harder it is for the price to move through them.
The lines basically show the limit supply and demand at that point.
Lines below the current price shows buys and lines above the current price shows the sells.
This tools gives you direct access to see where actually the buy/sell pressure is.
Use that knowledge.
Lines below the current price shows buys and lines above the current price shows the sells.
This tools gives you direct access to see where actually the buy/sell pressure is.
Use that knowledge.
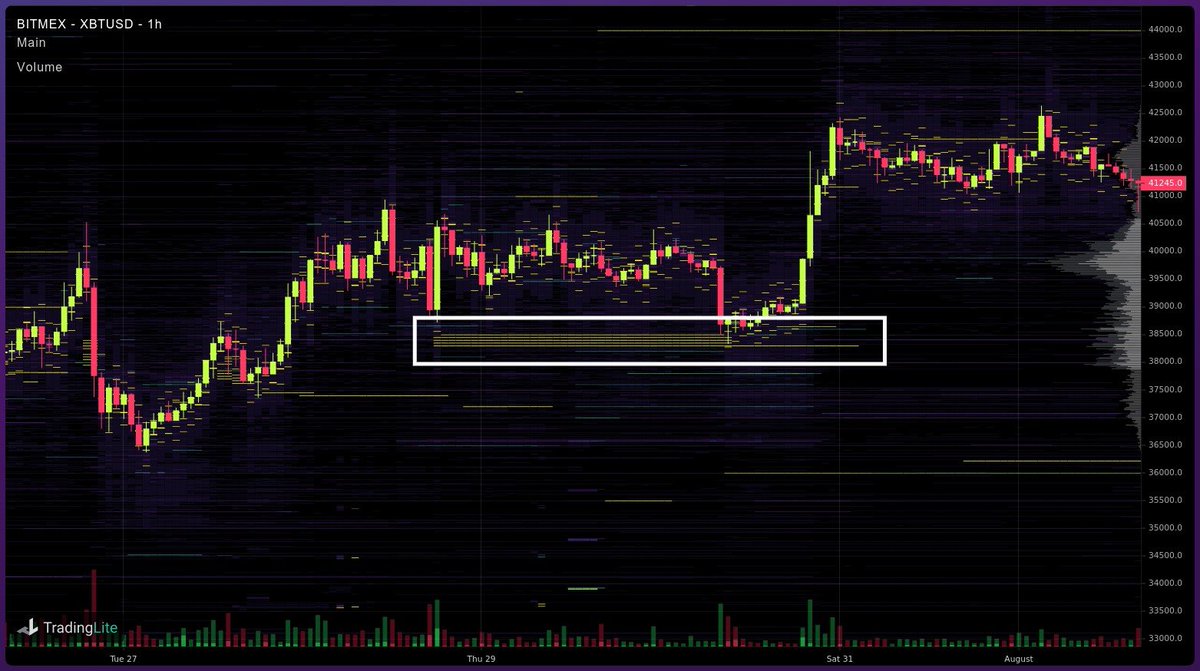
Here’s a good example.
Whale sets a ton of orders at $38.3k to $38.5k.
All but one gets filled. Price goes up 10% the same day.
That whale knew what he was doing.
Whale sets a ton of orders at $38.3k to $38.5k.
All but one gets filled. Price goes up 10% the same day.
That whale knew what he was doing.
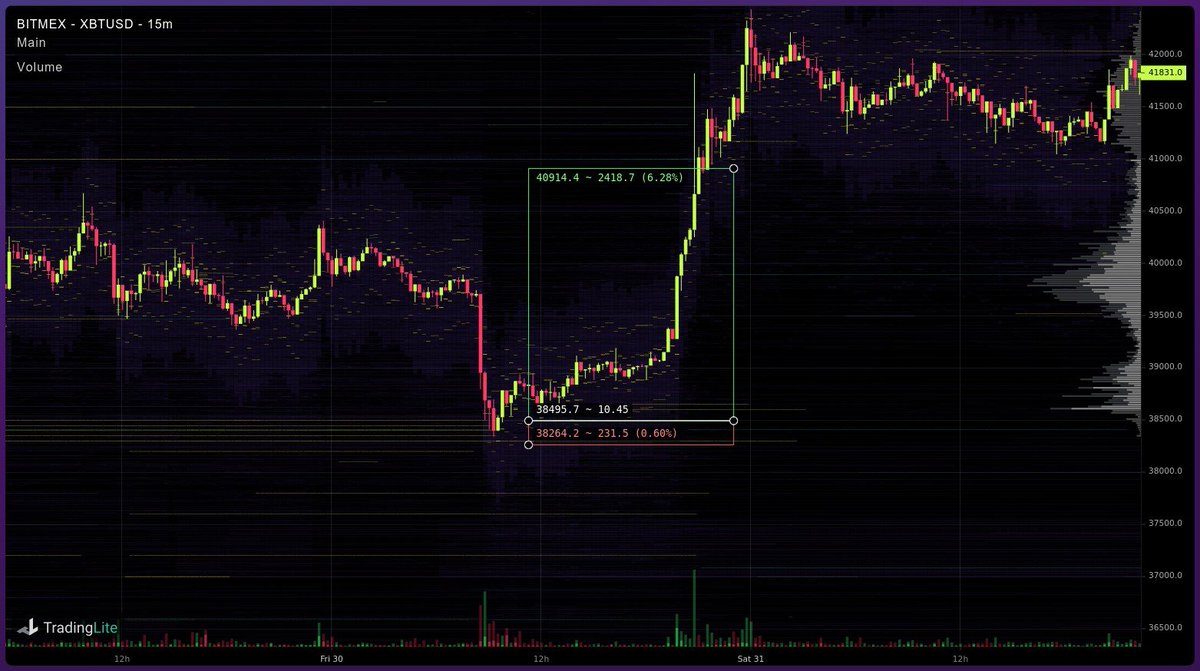
You can use this type of information for low time frame scalp setups.
Zooming in on the same example, let’s say you think that the price won’t go through all of the whale’s orders.
You enter a Long and place your Take Profit at previous resistance.
Just an example.
Zooming in on the same example, let’s say you think that the price won’t go through all of the whale’s orders.
You enter a Long and place your Take Profit at previous resistance.
Just an example.
Finally, you might be wondering what the horizontal chart on the right means.
That’s the Volume Profile for the Visible Range of the chart you’re looking at. We will study Volume Profile later.
It shows how much volume got traded at different price levels.
Quick view
That’s the Volume Profile for the Visible Range of the chart you’re looking at. We will study Volume Profile later.
It shows how much volume got traded at different price levels.
Quick view
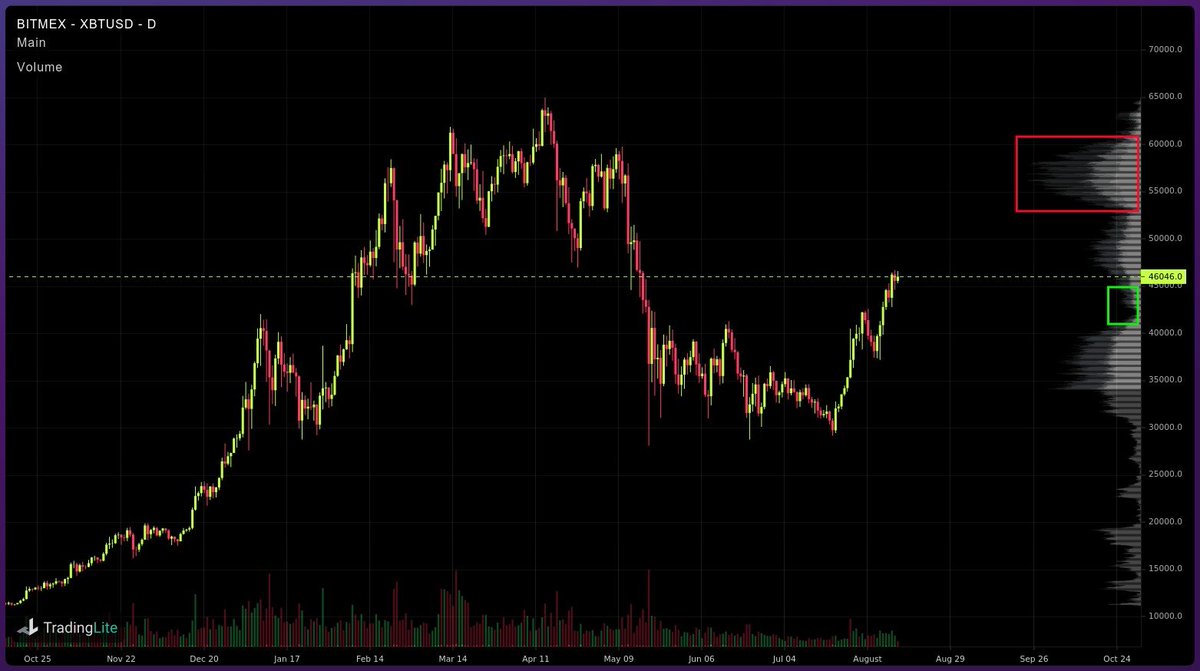
The Green box is Volume Gap. It means there isn’t a lot of Supply there, and the price can move through it easily.
The Red box is a high volume region. Lots of trapped Supply, and it’s going to be MUCH harder for the price to break through.
The Red box is a high volume region. Lots of trapped Supply, and it’s going to be MUCH harder for the price to break through.
Caveat.
Heatmaps can also be used by whales to make fake supply/demand walls to influence the decisions of the retail. Whilst not often, but it happens.
You will eventually notice is. Just remember to bet small in case you get trapped.
Heatmaps can also be used by whales to make fake supply/demand walls to influence the decisions of the retail. Whilst not often, but it happens.
You will eventually notice is. Just remember to bet small in case you get trapped.
The more you use it, the better you get.
Remember, it's just a tool and don't let it overwhelm you.
YOU ABSOLUTELY DON'T NEED TO USE ALL THE TOOLS.
Use it if you find it useful AND EASY.
This was an introduction to Heatmaps.
We will study other addition tools next.
Remember, it's just a tool and don't let it overwhelm you.
YOU ABSOLUTELY DON'T NEED TO USE ALL THE TOOLS.
Use it if you find it useful AND EASY.
This was an introduction to Heatmaps.
We will study other addition tools next.
If you liked this thread, I urge you to read further tutorials on how to trade practically using simple tools with practical only application on my telegram.
EVERYTHING I SHARE IS FREE and Crypto Oriented for Day and Swing trading. All the best.
t.me/EmperorbtcTA/4…
EVERYTHING I SHARE IS FREE and Crypto Oriented for Day and Swing trading. All the best.
t.me/EmperorbtcTA/4…
• • •
Missing some Tweet in this thread? You can try to
force a refresh