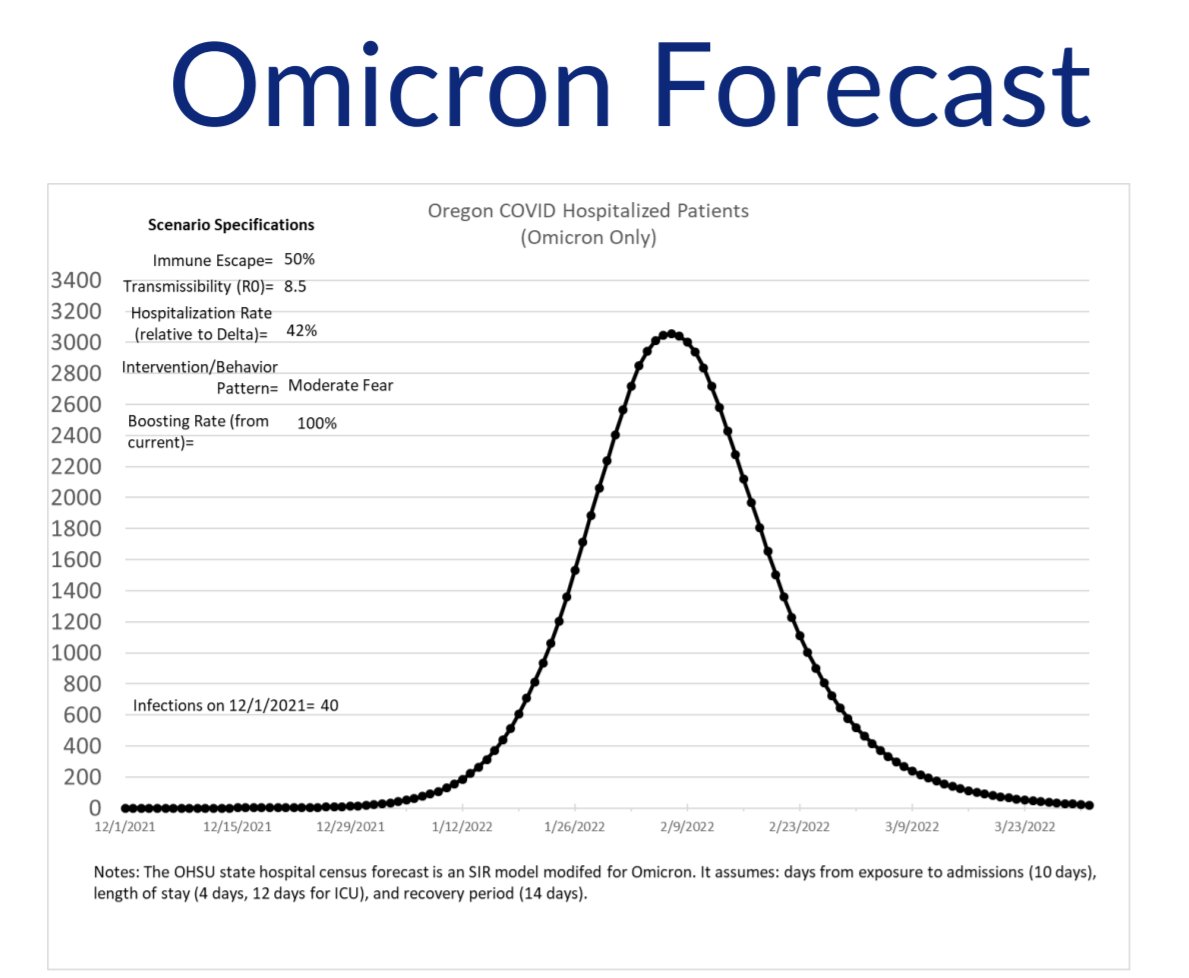
New OHA projection came out yesterday and it's a pretty dire prediction, as I'm sure you've seen. I think it's important to remember what went into this, and how it compares to other models that came out yesterday-ish from OHSU and IHME
First things first, a link to all the models I'm going to be talking about:
OHA 8/19:
oregon.gov/oha/covid19/Do…
OHSU 8/18:
ohsu.edu/sites/default/…
IHME 8/19:
healthdata.org/sites/default/…
OHA 8/19:
oregon.gov/oha/covid19/Do…
OHSU 8/18:
ohsu.edu/sites/default/…
IHME 8/19:
healthdata.org/sites/default/…
Using WebPlotDigitizer to extract data from the OHA Re graphic shows a peak Re of 2.01 on 20 July, pretty close to my simple model result of 2.09 on July 25. I've talked at length about the differences in the methods, but close enough for my jazz. (pats self on back) 

I agree with this paragraph. People are reacting on their own, as in earlier waves when Re crested 1-2 weeks before state NPI’s were enacted. It seems a foolish experiment to run now though, at the height of the pandemic to skip the second step. We shall see. 

The estimated population immunity from OHA, including vaccination and infections, discounting for efficacy, is only about 54%. This disagrees significantly with IHME (68%) and OHSU (77%) estimates, and explains some of the extremity of the model outcomes. 


In the non-immune community, each infection results in an estimated 3.3 new infections, which is rather staggering, but certainly seems to agree with what we’re seeing.
1.56 / 3.31=~47%, or the % vulnerable, just FYI how that came up with that 3.31 number.
1.56 / 3.31=~47%, or the % vulnerable, just FYI how that came up with that 3.31 number.

This is the controversial part of the model, and where the cadence of every 3 weeks shows it’s fault. It also shows the lack of creativity of the modelers, as in the past. They don't consider the possibility Re will continue to decrease, and stays at 1.56 as it was 4 August. 

It’s possible that the public reaction, and no state mandates will keep Re near 1.56.
The rate of Re decrease does show signs of slowing, but it's likely to settle closer to 1.2-4 than staying at >1.5 if we settle into a new steady state.
This is where the Re calculus is useful.


The rate of Re decrease does show signs of slowing, but it's likely to settle closer to 1.2-4 than staying at >1.5 if we settle into a new steady state.
This is where the Re calculus is useful.


It might keep on chugging downward to 1.0 and below without any further state interventions, but I'm skeptical of that in the short term. Over a long enough time period everyone will get infected and we have "herd immunity" but that's a lot of dead people...
Not a viable plan.
Not a viable plan.
The actual projection is extreme of course, and probably inaccurate. People have been responding to the horrific case and hospitalization rates; this isn’t going completely unabated, thankfully.
The government could be doing more to protect its people by implementing more NPIs.
The government could be doing more to protect its people by implementing more NPIs.

Comparing the hospitalization (census) projection between OHA, OHSU and IHME shows how much OHA diverges from those other two, and why I say it's far off base and too pessimistic. 


Again using WebPlotDigitizer I pulled the new daily hospitalizations and accumulated them so the OHA plot could be compared to the OHSU and IHME ones. Assumes 9 day avg hospitalization, per this ref-bmcinfectdis.biomedcentral.com/articles/10.11…
OHA is similar to the peak of the "worse" IHME projection


OHA is similar to the peak of the "worse" IHME projection


The discussion section is unreasonably short, noting "this alarming increase could be curbed if people" adopt NPIs, but neglects to mention that the state has the power to mandate this, and chooses not to do so. 

If this projection were to be believed, we would be approaching 100 deaths per day reported, which certainly would garner some state reaction I would hope, and so would not be allowed to happen (maybe in Florida, but not here). 

Anyways, here’s the actual data overlaid on the new projection in orange; it's already diverging to the low side, and should continue to do so.
Don't freak out because of this one dire projection from OHA, but because the state abandoned you July 1st.
Thanks for reading.
Don't freak out because of this one dire projection from OHA, but because the state abandoned you July 1st.
Thanks for reading.

Replies are off for this long thread, just to keep it from getting too messy, but of course if you tweet at me I'll try to answer questions as they come up.
Please wear a mask, keep your loved ones safe, and try to keep yourself out of the hospital for a few weeks.
Please wear a mask, keep your loved ones safe, and try to keep yourself out of the hospital for a few weeks.
Addendum (I should have done this earlier but was lazy):
I scraped the IHME and OHSU worst case hospitalizations and plotted them against the OHA one. The OHA one clearly the outlier, rising as fast as OHSU and as high as IHME.
They really got this one wrong.
I scraped the IHME and OHSU worst case hospitalizations and plotted them against the OHA one. The OHA one clearly the outlier, rising as fast as OHSU and as high as IHME.
They really got this one wrong.

• • •
Missing some Tweet in this thread? You can try to
force a refresh


