Machine learning is more than function fitting.
Even though most of us are introduced to the subject through this example, fitting functions to a training dataset seemingly doesn't give us any deep insight about the data.
This is what's working behind the scenes!
🧵 👇🏽
Even though most of us are introduced to the subject through this example, fitting functions to a training dataset seemingly doesn't give us any deep insight about the data.
This is what's working behind the scenes!
🧵 👇🏽
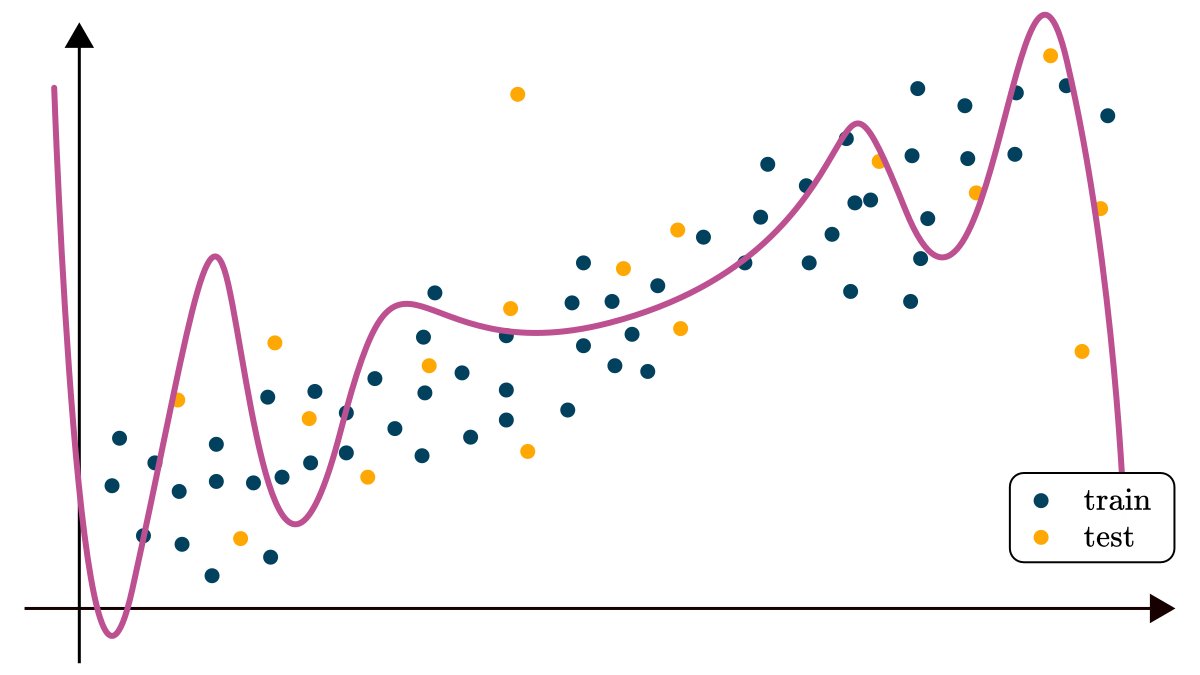
Consider a simple example: predicting the value 𝑦 from the observation 𝑥; for instance 𝑦-s are real estate prices based on the square footage 𝑥.
If you are a visual person, this is how you can imagine such dataset.
If you are a visual person, this is how you can imagine such dataset.

The first thing one would do is to fit a linear function 𝑓(𝑥) = 𝑎𝑥 + 𝑏 on the data.
By looking at the result, we can see that something is not right. Sure, it might capture the mean value for a given observation, but the variance and the noise in the data is not explained.
By looking at the result, we can see that something is not right. Sure, it might capture the mean value for a given observation, but the variance and the noise in the data is not explained.

Next, we might try to fit a more expressive function, say a polynomial, but that only seems to make things worse by potentially overfitting on the training dataset.
We need an entirely different model to really explain the dataset.
We need an entirely different model to really explain the dataset.
This is where probabilities come in.
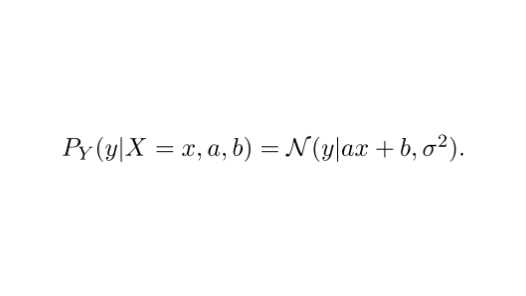
Instead of a deterministic function, we estimate the probability distribution of the observations.
If 𝑋 is the distribution of our data and 𝑌 is the corresponding observation, we can model their relation with a Gaussian distribution.
Instead of a deterministic function, we estimate the probability distribution of the observations.
If 𝑋 is the distribution of our data and 𝑌 is the corresponding observation, we can model their relation with a Gaussian distribution.
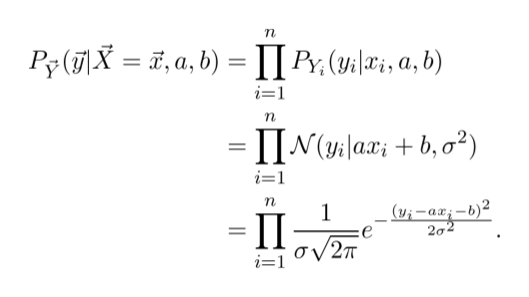
We can fit this model by maximizing the likelihood function.
Essentially, for a given set of parameters 𝑎 and 𝑏, the likelihood describes the probability that we observe the training data.
The higher it is, the better the model fits.
Essentially, for a given set of parameters 𝑎 and 𝑏, the likelihood describes the probability that we observe the training data.
The higher it is, the better the model fits.
It turns out that maximizing the likelihood is the same as minimizing the Mean Squared Loss!
(Don't worry about the computational details yet, I'll have you covered soon.)
(Don't worry about the computational details yet, I'll have you covered soon.)

The result?
A probabilistic model that explains the entire dataset, not just its mean. Every time you fit a linear regressor, probability and statistics are working in the background.
A probabilistic model that explains the entire dataset, not just its mean. Every time you fit a linear regressor, probability and statistics are working in the background.

Of course, there is much more behind the surface.
If you are interested in the technical details, check out my post below!
(All mathematical prerequisites on probability are covered.)
tivadardanka.com/blog/the-stati…
If you are interested in the technical details, check out my post below!
(All mathematical prerequisites on probability are covered.)
tivadardanka.com/blog/the-stati…
• • •
Missing some Tweet in this thread? You can try to
force a refresh