1/ Unsettled: What Climate Science Tells Us, What It Doesn't, and Why It Matters (Steven Koonin)
"This book is about how science, with its certainties and uncertainties, becomes The Science—how it gets communicated, & what’s lost in the process." (p. 15)
amazon.com/Unsettled-Clim…
"This book is about how science, with its certainties and uncertainties, becomes The Science—how it gets communicated, & what’s lost in the process." (p. 15)
amazon.com/Unsettled-Clim…

2/ This is the author's Wikipedia page. There has been a vigorous back-and-forth discussion about this book's content.
The author has worked for BP, NYU, and Obama (undersecretary for science).
en.wikipedia.org/wiki/Steven_E.…
Thomas Kuhn's work is also relevant:
The author has worked for BP, NYU, and Obama (undersecretary for science).
en.wikipedia.org/wiki/Steven_E.…
Thomas Kuhn's work is also relevant:
https://twitter.com/ReformedTrader/status/1331998734276653059
3/ “The science of climate is neither settled nor sufficient to dictate policy. Rather than an existential crisis, we face a wicked problem that requires a pragmatic balancing of costs and benefits.” —William W. Hogan, professor of global energy policy at Harvard Kennedy School
4/ "Very few people read the assessment summaries, let alone the research papers themselves.
"Policymakers have to rely on information that’s been put through several different wringers by the time it gets to them.
"Getting the story straight isn't as easy as it sounds." (p. 2)
"Policymakers have to rely on information that’s been put through several different wringers by the time it gets to them.
"Getting the story straight isn't as easy as it sounds." (p. 2)

5/ "I was shaken by the realization that climate science was far less mature than I had supposed.
"The science is insufficient to make useful projections about how the climate will change over the coming decades, much less what effect our actions will have on it."
"The science is insufficient to make useful projections about how the climate will change over the coming decades, much less what effect our actions will have on it."
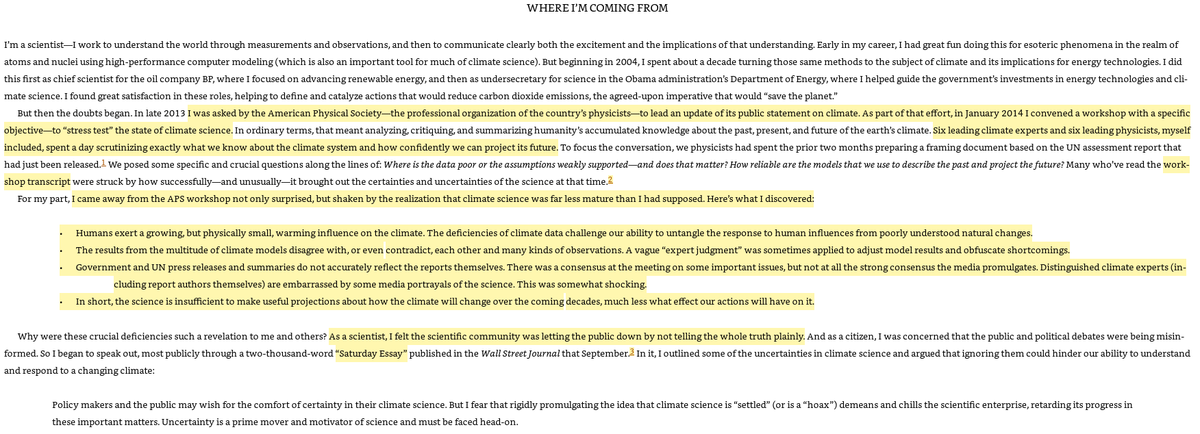
6/ "The chair of a highly-respected earth sciences department told me, “I agree with pretty much everything you wrote, but I don’t dare say that in public.”
"This book is based on information from official assessments or quality research literature presented in context." (p. 5)
"This book is based on information from official assessments or quality research literature presented in context." (p. 5)
7/ “Colleagues who share some of my doubts argue that the only way to get change is to frighten people and that it necessary for scientists to exaggerate. They tell me my belief in open and honest assessment is naïve.” —Daniel Botkin, former chair of environmental studies at UCSB
8/ "Open debate is at the heart of the scientific process; it is absurd that scientists should fear being labeled antiscience for engaging in it.
"In that light, this book issues a challenge and solicits, indeed welcomes, informed argument and disagreement." (p. 16)
"In that light, this book issues a challenge and solicits, indeed welcomes, informed argument and disagreement." (p. 16)
9/ "Influence, response, & impact form the core questions of climate science:
"How have humans influenced climate? How will those influences change in the future? How does climate respond to human (and natural) influences? How will that response impact ecosystems and societies?
"How have humans influenced climate? How will those influences change in the future? How does climate respond to human (and natural) influences? How will that response impact ecosystems and societies?
10/ "Science being what it is, none of these answers is or ever will be entirely certain.
"Since the answer to each question depends upon the answer to the one before it, we can expect answers to the final—and perhaps most significant—question to be the most uncertain." (p. 18)
"Since the answer to each question depends upon the answer to the one before it, we can expect answers to the final—and perhaps most significant—question to be the most uncertain." (p. 18)
11/ " “Anomalies” measure how much the observed temperature at a location deviates from the baseline (avg) at that location, usually chosen as the average over a 30-year period in the middle of the time span considered.
"There is a rise of 1.1°C over 120 years (0.09°C/decade).
"There is a rise of 1.1°C over 120 years (0.09°C/decade).
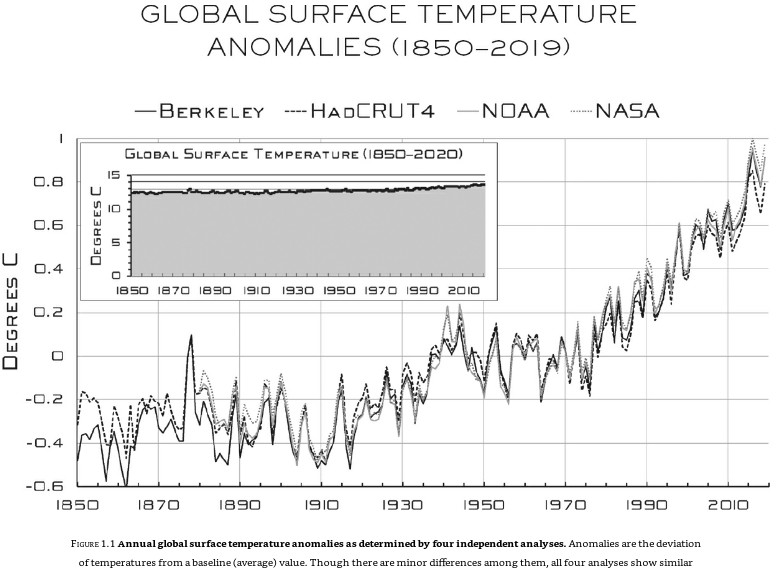
12/ "The rate of rise was twice as large as our 0.09ºC/decade long-term average during the forty years from 1980 to 2020 (0.20ºC/decade), while it was negative during the forty years from 1940 to 1980 (–0.05ºC/decade).
13/ "For the 30 years before that, from 1910 to 1940, the rate was again nearly twice the 0.09ºC/decade average (0.17ºC/decade). So trends are highly dependent on the time span being considered; we can get almost any trend we want depending upon the interval we choose." (p. 31)
14/ "The localized blobs are likely the result of urbanization or the growth of activities in rural areas that began producing oil & gas.
"Avoiding confusion of local and global effects is why professionals smooth maps of temperature changes over distances of 1,200 km." (p. 34)
"Avoiding confusion of local and global effects is why professionals smooth maps of temperature changes over distances of 1,200 km." (p. 34)

15/ "Human influences were negligible before 1900. There weren’t many people around (1/5 of today’s count), and they were mostly farming; industrialization was just getting underway for most of the globe. Human influences were small as late as 1950 (<1/4 of what they are today).
16/ "Pre-1950 variations show other phenomena to have been at play.
"Since internal variability/natural forcings are still present, it is important to understand them to confidently attributing even part of recent warming to human influences, much less project changes." (p. 36)
"Since internal variability/natural forcings are still present, it is important to understand them to confidently attributing even part of recent warming to human influences, much less project changes." (p. 36)
17/ "There is an upward trend in the oceans’ heat energy, with the upper 300 m warming more rapidly.
"The temperature rise it represents is very modest: a few hundredths of a °C/decade. Nevertheless, ocean heat is the surest indication of the planet warming in recent decades.
"The temperature rise it represents is very modest: a few hundredths of a °C/decade. Nevertheless, ocean heat is the surest indication of the planet warming in recent decades.

18/ "Lest you think the matter is settled, a different peer-reviewed analysis found that the heat content increased between 1990-2015 at only half the rate shown in Figure 1.6, with the same smaller rate of increase also between 1921-46, when human influences were much smaller.
19/ "Another paper found that the upper 2 km of ocean warmed from 1750-1950 at a rate one-third of that shown in the figure. So as with surface temperatures, poor historical data and large natural variability complicate efforts to understand the role of human influences." (p. 40)
20/ "Because of the limited evidence, the most recent assessment report has only low confidence that the global warming of the past 30 years has exceeded the range of reconstructed temperatures.

21/ "But proxy data are better and more plentiful for the Northern Hemisphere (where there’s more land), so AR5 has medium confidence that the last 30 years were likely (2/3 chance) the warmest thirty-year period of the last fourteen hundred years for the Northern Hemisphere.
22/ "None of these proxies for temperature is as good as a direct measurement w/ a thermometer. They directly reflect conditions at only a single location and can be complicated to interpret—for example, tree growth is sensitive not just to temperature but precipitation as well.
23/ "And uncertainties grow as you go further back in time. But proxies do give us a sense of how the climate changed before there were humans systematically observing and recording the weather." (p. 41)
24/ "Past variations of surface temperature and ocean heat content do disprove that the ~1ºC rise in the global average surface temperature anomaly since 1880 is due to humans, but they do show that there are powerful natural forces driving the climate as well,

25/ "and they illuminate the challenge of understanding those natural influences well enough to confidently identify the climate’s response to human ones. The real question is not whether the globe has warmed recently but rather to what extent this is caused by humans." (p. 42)
26/ "Precision measurements of global albedo are important. If the average albedo were to increase from 0.30 to 0.31, say because of a 5% increase in cloudiness, that additional reflectivity would compensate for the warming influence of doubling the atmosphere’s CO2." (p. 46)
27/ "Hundreds of thousands of molecular properties go into simulated spectra, which agree w/ satellite observations."
"Although today’s CO₂ is significant (7.6%), doubling CO₂ doesn’t change things much (an additional 0.8%) due to the “painting a black window” effect." (p.51)
"Although today’s CO₂ is significant (7.6%), doubling CO₂ doesn’t change things much (an additional 0.8%) due to the “painting a black window” effect." (p.51)

28/ "There are other human and natural influences that can confuse the picture. Among the other human influences are methane (from fossil fuels but more importantly from agriculture) and other minor gases that together exert an influence almost as great as from human-caused CO2.
29/ "Human-caused aerosols, together with changes in land use like deforestation (pasture is more reflective than forest), increase the albedo and so exert a net cooling influence that cancels about half of the warming influence of human-caused greenhouse gases." (p. 56)
30/ "While effects of CO2/greenhouse gases are known to within 20%, uncertainty in the cooling influence of human-caused aerosols is larger, making total human-caused forcing uncertain by 50%. The best we can say is that net human influence is very likely between 1.1-3.3 W/m2.

31/ "The fact that human influences currently amount to only 1% of the energy that flows through the climate system has important implications. To usefully measure them/their effects, we have to observe & understand the larger parts (the other 99%) with precision better than 1%.
32/ "Small natural influences must also be understood to that same precision, and we have to be sure they’re all accounted for. This is an enormous challenge in a system for which we have limited observations for a limited time & about which our uncertainties are large." (p. 57)
33/ "60% (30-55%, 15-30%) of CO₂ emitted today will remain in the atmosphere 20 years (a century, one thousand years) from now. This is an impediment to reducing human influences on the climate.
"Just to stabilize the CO2 concentration, global emissions would have to *vanish*.
"Just to stabilize the CO2 concentration, global emissions would have to *vanish*.

34/ "Methane, the 2nd-most important human-caused greenhouse gas, has been increasing.
"The cause of the 1998-2008 plateau is yet another uncertainty.
"Lower concentration/shorter lifetime but greater warming potency must be accounted for when comparing CH₄ & CO₂." (p. 69)
"The cause of the 1998-2008 plateau is yet another uncertainty.
"Lower concentration/shorter lifetime but greater warming potency must be accounted for when comparing CH₄ & CO₂." (p. 69)

35/ "Most methane emissions arise from digestion in cattle and other agricultural activities, particularly rice cultivation; the decay of material in landfills is also significant. Any effort to drastically reduce emissions must also address those sources." (p. 69)

36/ "Despite the certainty with which projections are reported as facts, estimating human influences is a highly uncertain business. Imagine being back in 1900 and trying to project what civilization would be like in the year 2000.
37/ "Historically, two of the most important drivers of emissions have been growing population and growing economic activity.
"The diversity of emissions assumptions among the scenarios leads to a similar diversity of human influences on the climate at century’s end." (p. 72)
"The diversity of emissions assumptions among the scenarios leads to a similar diversity of human influences on the climate at century’s end." (p. 72)

38/ "A recent analysis of emissions from 2005 to 2017 shows that high-emissions scenarios are increasingly implausible because of slower economic growth through 2040 and reduced coal use through the end of the century.
39/ "Human influences will continue to grow in any scenario short of ceasing all emissions. If future emissions are only reduced modestly, human influences will continue to grow. But ceasing all emissions is a practical impossibility, as I'll discuss in Part II." (p. 74)
40/ "The scant two-week-long accuracy of weather forecasts reflects a fundamental problem described by Ed Lorenz at MIT in 1961. Weather is chaotic—small changes in how we start the model can lead to very different predictions after a few weeks.
41/ "No matter how precisely we specify current conditions, uncertainty in predictions grows exponentially into the future. More computer power cannot overcome this.
"But climate is not weather; it’s the average over decades. There’s reason to believe that’s possible." (p. 79)
"But climate is not weather; it’s the average over decades. There’s reason to believe that’s possible." (p. 79)
42/ "Models use only single values of temperature, humidity, and so on to describe conditions within a grid box; yet important phenomena occur on scales smaller than the 100 km grid size (such as mountains, clouds, and thunderstorms), so researchers must make subgrid assumptions.

43/ "Clouds influence flows of sunlight & heat. Depending upon type and formation, clouds reflect sunlight or intercept heat in varying amounts. The numbers and types present in each layer of atmosphere above a grid square (the stacked boxes) generally depend on conditions there.
44/ "Changes and differences in clouds occur on a much smaller scale than that of a grid box, so assumptions are necessary.
"While modelers base subgrid assumptions upon both physical laws and observations of weather phenomena, there is still considerable judgment involved.
"While modelers base subgrid assumptions upon both physical laws and observations of weather phenomena, there is still considerable judgment involved.

45/ "Since modelers make varying assumptions, results can vary widely. Ordinary fluctuations in the height & coverage of clouds can have impact sunlight & heat flows as do human influences. The greatest uncertainty in climate modeling stems from the treatment of clouds." (p. 81)
46/ "A finer grid introduces another complication: Any computation is only accurate if things don’t change too much (don’t move more than one grid box) over one time step. So if the grid is finer, the time step has to be smaller, meaning even more computer time will be required.
47/ "As an illustration, a simulation that takes two months to run with 100 km grid squares would take more than a century using 10 km squares. The run time would remain at two months if we had a supercomputer 1000x faster than today’s—a capability decades in the future." (p. 82)
48/ "To accurately describe vertical variations, the several dozen grid boxes stacked up into the atmosphere above each square (or below it into the ocean) have to be more like very flat pancakes than like cubes, typically some one hundred times wider than they are high.
49/ "Pancake boxes give a more accurate simulation where the atmosphere is flowing in layers but become a problem below 10 km, where turbulent weather happens. Upward flows of energy/water vapor (think thunderhead clouds) occur over areas much smaller than the 100 km of our grid.
50/ "The flow of energy carried into the atmosphere by evaporation of ocean waters is >30x larger than the human influences shown in Figure 2.4. Subgrid assumptions about moist convection—air/water vapor moving vertically through grid boxes—are crucial to accurate models." (p.83)
51/ "These are only two examples out of dozens of subgrid assumptions that must be set. How much water evaporates from the land surface depending upon the soil properties, plant cover, and atmospheric conditions? How much snow or ice is on the surface? How do ocean waters mix?
52/ "Modelers tune these parameters to get a better match with features of the real climate system.
"UK researchers tuned their latest model in part by adjusting how partial snow cover changes the albedo of northern forests (snow reflects more than treetops).
"UK researchers tuned their latest model in part by adjusting how partial snow cover changes the albedo of northern forests (snow reflects more than treetops).
53/ "They also chose to adjust how much C₂H₆S is produced by microorganisms on the ocean—that chemical produces aerosols, increasing albedo.
"It is impossible—for practical & fundamental reasons—to tune dozens of parameters to match the far more numerous observed properties.
"It is impossible—for practical & fundamental reasons—to tune dozens of parameters to match the far more numerous observed properties.
54/ "Not only does this cast doubt on whether the conclusions of the model can be trusted, it makes it clear that we don’t understand features of the climate to anywhere near the level of specificity required given the smallness of human influences.
55/ "Among the most important things that a model has to get right are “feedbacks.” The growing greenhouse gas concentrations that raise the global temperature can also cause other changes in the climate system that either amplify or diminish their direct warming influence.
56/ "For example, as the globe gets warmer, there’ll be less snow and ice on the surface, which decreases the planet’s albedo. The less reflective earth will then absorb more sunlight, causing even more warming.
57/ "Another example is that as the atmosphere warms, it will hold more water vapor, which further enhances its heat-intercepting ability. But more water vapor will also change the cloud cover, enhancing both heat interception (high clouds) and reflectivity (low clouds).
58/ "On balance, reflectivity wins, and net cloud feedback somewhat diminishes direct warming. The size, or in some cases even the sign, of these feedback effects—that is, whether they enhance or diminish the direct influence—cannot be understood precisely from first principles
59/ "but must emerge from a model as it’s tuned, and each model will give somewhat different answers. The average of results over many different models suggests that the net effect of all feedbacks is to double or triple CO₂’s direct warming influence." (p. 84)
60/ "A paper describing of one of the most esteemed models, that of the Max Planck Institute, tells of tuning a subgrid parameter by a factor of ten because the originally chosen value resulted in twice as much warming as had been observed. That’s really dialing the knob." (p.86)
61/ "Comparisons among models within ensembles show that, on scales required to measure the climate’s response to human influences, model results differ dramatically both from each other & from observations. But you wouldn’t know that unless you read deep into the IPCC report.
62/ "The simulated global average surface temperature (not the anomaly) varies among models by about 3ºC (5.6ºF), three times greater than the observed value of the twentieth-century warming they’re purporting to describe and explain." (p. 86)
63/ "The agreement of ensemble averages with observations *looks* impressive, but one of the world’s most accomplished climate modelers has said that 'it’s reasonable to assume there has been some tuning, implicit if not explicit, in models that fit the temperature history well.'
64/ "The spread of the CMIP5 ensemble after 1960 is larger than that of the models in CMIP3: the later generation of models is more uncertain than the earlier one. Even as the models became more sophisticated—finer grids, fancier subgrid parametrizations—uncertainty increased.

65/ "The ensembles fail to reproduce the strong warming observed from 1910-1940. (The observed early twentieth-century warming is comparable to the observed late twentieth-century warming, which the assessment reports attribute with “high confidence” to human influences.)" (p.88)
66/ "Climate observations show repeating behaviors. At least some are due to slow changes in ocean currents and ocean-atmosphere interactions.
"Because we have only 150 years of good observations, systematic behaviors that occur over longer timescales are less well known.
"Because we have only 150 years of good observations, systematic behaviors that occur over longer timescales are less well known.

67/ "There almost certainly are other natural cyclic variations occurring over even longer periods. Cycles like these influence global and regional climates and are superimposed upon any trends due to human or natural forcings like greenhouse gas emissions or volcanic aerosols.
68/ "They make it difficult to determine which observed changes in the climate are due to human influences and which are natural.
"While a number of models do produce something like the AMO, their versions of it differed from model to model & from observations in many respects.
"While a number of models do produce something like the AMO, their versions of it differed from model to model & from observations in many respects.
69/ "Most notably, the timescales for the AMO-like cycle produced by the models ranged from forty years to a century or more.
"The models were not any better at reproducing the multidecadal variability in the Pacific basin." (p. 88)
"The models were not any better at reproducing the multidecadal variability in the Pacific basin." (p. 88)
70/ "An analysis of 267 simulations run by 29 different CMIP6 models created by nineteen modeling groups around the world shows that they do a very poor job of describing warming since 1950 and continue to underestimate the rate of warming in the early twentieth century." (p. 90)

71/ "The failure of even the latest models to warm rapidly enough in the early 20th century suggests that it’s possible, even likely, that internal variability—natural ebbs and flows of the climate system—has contributed significantly to the warming of recent decades." (p. 90)
72/ "Max Planck Institute modelers: 'We have documented how we tuned the MPI-ESM1.2 global climate model to match the instrumental record warming; an endeavor which has clearly been successful. Due to the historical order of events, the choice was to do this practically
73/ " 'by targeting an ECS of about 3 K [3ºC] using cloud feedbacks, as opposed to tuning the aerosol forcing.'
"In other words, the researchers tuned their model to make its sensitivity to greenhouse gases what they thought it should be. Talk about cooking the books." (p. 93)
"In other words, the researchers tuned their model to make its sensitivity to greenhouse gases what they thought it should be. Talk about cooking the books." (p. 93)
74/ "Because of this large but uncertain cooling by aerosols, a model with high sensitivities to both aerosols and greenhouse gases could describe the historical record about as well as one with much lower sensitivities." (p. 94)

75/ On objections to geoengineering via albedo modification:
"If “uncertainties in modeling” mean models can’t give us useful information about what albedo modification might do, it’s hard to see why they'd be better at predicting the response to other human influences." (p. 96)
"If “uncertainties in modeling” mean models can’t give us useful information about what albedo modification might do, it’s hard to see why they'd be better at predicting the response to other human influences." (p. 96)
76/ "Observations extending back over a century indicate that most types of extreme weather events don’t show any significant change—and some have become less common or severe—even as human influences on the climate grow. In general, there are high levels of uncertainty involved.

77/ "Reasons for low confidence in detecting changes in extreme weather events and then attributing them to human influences include short/low-quality historical records, high natural variability, confounding natural influences, & disagreements among the many models used." (p.97)
78/ "The record highs show the warm 1930s, but there is no significant trend over the 120 years of observations, or even since 1980, when human influences grew strongly. In contrast, the numbers of record daily cold temperatures decline, with that trend accelerating after 1985.

79/ "These two panels together show something that is completely contrary to common perception—that temperature extremes in the contiguous US have become less common and somewhat milder since the late nineteenth century." (p. 106)
80/ "Of course, temperatures getting milder in this way (fewer harsh winters and cold evenings) makes for a very different (and less alarming) story than torrid summers and blazing afternoons becoming more common." (p. 110)
81/ "Strong hurricane activity closely tracks sea surface temperature until about 2008... then it doesn’t. That’s b/c there are other factors, including the amount of wind shear (variation of wind speed or direction with altitude) & the presence of dust from the Sahara." (p. 113)


82/ "While it is not unreasonable to think that warming might indeed lead to some kind of change in hurricane activity at some point, right now there simply isn’t evidence that this is happening.
83/ "Yes, economic damages from hurricanes are increasing, but that’s because there are more people and more valuable infrastructure near the coasts, not because storm characteristics are changing long-term." (p. 120)
84/ "We have to correct for the observing bias in favor of strong storms early in the record.
"As human influences have grown since mid-20th century, the number of significant tornadoes hasn’t changed much, but the strongest storms have become less frequent." (p. 122)
"As human influences have grown since mid-20th century, the number of significant tornadoes hasn’t changed much, but the strongest storms have become less frequent." (p. 122)


85/ "Declining snow cover is consistent with a warming globe, though another factor might be dust and soot on the snow, which accelerates melting by absorbing sunlight. However, there has been no change in the ten-year avg since 1990, even as the globe has warmed 0.5°C." (p. 136)

86/ "Trends in flooding vary across the country, with some locations experiencing increases and some decreases.
"For changes in floods globally, AR5 expresses “low confidence regarding the sign of trend in the magnitude and/or frequency of floods on a global scale.” " (p. 137)
"For changes in floods globally, AR5 expresses “low confidence regarding the sign of trend in the magnitude and/or frequency of floods on a global scale.” " (p. 137)

87/ "While there have been brief regional variations, and the past fifty years have been slightly wetter, it’s difficult to see much long-term change. AR5 states “low confidence in a global-scale trend in drought or dryness since the middle of the 20th century.” " (p. 137)

88/ "Models project that the Southwest will become steadily drier as the globe warms, but the data shown for the 20th century are well within the historical context and, as the AR5 notes, the current impact of human influences seems weak in comparison with natural variability.


89/ "A study published in 2020 confirms the notion that a leading cause of multiyear US droughts over the past millennium has been internal variability of the atmosphere." (p. 140)
90/ "As the world gets more connected through communications, we become more aware of floods, droughts, and fires when they happen. But in the end, the data tells us there’s not very much changing very quickly with precipitation, either globally or in the U.S." (p. 148)
91/ "The global mean sea level was rising at the end of the 19th century—well before significant human influences—and since 1880 risen by 10 inches (average of 0.07 inches/year). The rate over shorter periods has fluctuated; for the past 3 decades, it’s been 0.12 inches/year.

92/ "In the context of the earth’s hydrological cycle, these are small numbers—3 mm of sea level rise per year is roughly 0.3% of the planet’s annual precipitation—so it’s not surprising that there are variations from decade to decade." (p. 153)
93/ "Since the rate varies so much, it’s hard to know for recent years what’s human-caused and what’s natural.
"The implications are murky, both because of the shortness of the record and because there was acceleration well before human influences were significant." (p. 156)
"The implications are murky, both because of the shortness of the record and because there was acceleration well before human influences were significant." (p. 156)


94/ "Future global sea level rise is uncertain not only because of all of the model uncertainties in the global temperature rise, but also because the dynamics of the Greenland and Antarctic ice sheets are quite uncertain." (p. 158)

95/ "Under RCP2.6 (which has global emissions vanishing in the latter half of this century), the IPCC projects levels will rise 0.43 m (two-thirds chance 0.29-0.59 m) over the 21st century. For the extreme, emissions-heavy RCP8.5, the projection is 0.84 m (2/3 likely 0.61-1.10m).
96/ "These projections correspond to 4.3 and 8.4 mm/yr, respectively. Both are larger than the current 3 mm/yr but depend upon dubious models and their shaky grasp of the changes in the Antarctic & Greenland ice sheets that account for the bulk of sea level rise." (p. 158)
97/ "The rate has varied a lot.
"The records of tide gauges show a 60-year cycle. It's reasonable to expect the rate to decline again.
"The _average_ projected rates - even the low RCP2.6 rate of 5.5 mm/yr - would be so unusually high as to fall outside the scale of this chart.
"The records of tide gauges show a 60-year cycle. It's reasonable to expect the rate to decline again.
"The _average_ projected rates - even the low RCP2.6 rate of 5.5 mm/yr - would be so unusually high as to fall outside the scale of this chart.

98/ "We don’t know how much of the rise in global sea levels is due to human-caused warming and how much is a product of long-term natural cycles.
"Because ice melting lags behind warming (and also because of the persistence of CO₂),
"Because ice melting lags behind warming (and also because of the persistence of CO₂),
99/ "even if we were the culprit and ceased all emissions tomorrow, global sea level would continue to rise.
"Local sea level changes and their effects are far more complicated still, involving ocean currents, erosion, weather patterns, and land use and composition." (p. 165)
"Local sea level changes and their effects are far more complicated still, involving ocean currents, erosion, weather patterns, and land use and composition." (p. 165)
100/ On crop prices: "The profound difficulties in modeling supply/demand are compounded by uncertainties in climate projections.
"Projected price impacts of human-induced climate changes through 2050 are not only uncertain but also much smaller than past variations." (p. 176)
"Projected price impacts of human-induced climate changes through 2050 are not only uncertain but also much smaller than past variations." (p. 176)

101/ "An impact of 3% in 2100—80 years from now—translates to a decrease in the annual growth rate by an average of 3% divided by 80, or 0.04%/per year. The IPCC scenarios assume an average global annual growth rate of 2% through 2100.

102/ "The climate impact would then be a 0.04 percent decrease in that 2% growth rate, for a resulting growth rate of 1.96% . In other words, the UN report says that the economic impact of human-induced climate change is negligible, at most a bump in the road." (p. 178)
103/ "According to NCA2018, the curve for a warming of 7.2°C (13°F)—a level of warming well beyond what’s projected under even the most extreme IPCC scenario—would result in a 10% hit between now and 2090, which amounts to only a 5-year delay in growth 70 years from now." (p.181)


104/ "Science stories are almost always stories of nuance; they require time and research. Unfortunately, the pace of the news cycle has only become more frantic, and reporters and editors have less time than ever.
105/ "The general lack of knowledge of what the science actually says, the drama of extreme weather events and their heart-rending impact on people, and pressures within the industry all work against balanced coverage in the popular media.
106/ "Unfortunately, while climate science and energy issues are complicated, complexity and nuance don’t lend themselves well to political messaging. So the science is jettisoned in favor of The Science and “simplified,” which allows solutions to be portrayed simply as well.
107/ "This isn’t a climate-specific problem. It’s hard to rally the base with uncertainty. There would be less support for, say, renewable energy sources if portrayed as a possible way to mitigate a possible future problem instead of an essential solution to an imminent crisis.
108/ "Uncertainty can be a political weapon. Politicians on the right who deny even the basics—that human influences have played a role in warming the globe—are not above exploiting climate science uncertainties, offering them as “proof” that the climate isn’t changing after all.
109/ "Politicians on the left find it inconvenient to discuss scientific uncertainties or the magnitude of the practical challenge. They declare science 'settled' and label anyone who questions it “a denier,” including conscientious scientists advocating more research." (p. 188)
110/ Carl Wunsch: "This is like what goes on in the medical business: Small, poorly controlled studies are used to proclaim the efficacy of some new drug or treatment."
"Otherwise rigorous scientists abandon their critical faculties when discussing climate and energy issues.
"Otherwise rigorous scientists abandon their critical faculties when discussing climate and energy issues.
111/ "Science should be open to intense scrutiny and questioning, and scientists should approach it with their usual critical objectivity (without having to be afraid).
"The media accord NGOs an authoritative stance. But these are also interest groups with their own agendas.
"The media accord NGOs an authoritative stance. But these are also interest groups with their own agendas.
112/ "For many, the “climate crisis” is their raison d’etre. They also have to worry about being outflanked by more militant groups.
"When I tell people the things the assessment reports really say, many immediately ask whether I was a Trump supporter. I was not." (p. 192)
"When I tell people the things the assessment reports really say, many immediately ask whether I was a Trump supporter. I was not." (p. 192)
113/ "Peer review will usually catch major errors but is far from perfect, and it in no sense guarantees the correctness of what gets published. Independent replication by other researchers is a much stronger signal of correctness." (p. 199)
More on this:
https://twitter.com/ReformedTrader/status/1336398442403307521
114/ "Unlike the peer review of research papers, for climate assessment reports, disagreements among reviewers and lead authors are not resolved by an independent referee; the lead author can choose to reject a criticism simply by saying “We disagree.” " (p. 199)
115/ "This process does not promote objectivity.
"While the _research_ contained in the reports might indeed be subject to the type of peer review the public expects of scientific findings, the reports’ summaries and conclusions are not." (p. 200)
"While the _research_ contained in the reports might indeed be subject to the type of peer review the public expects of scientific findings, the reports’ summaries and conclusions are not." (p. 200)
116/ "The “97% consensus” study was debunked. And nobody has specified exactly what those scientists are agreed on. Climate changing? Sure. That humans are influencing it? I’m there! That we’re already seeing disastrous weather impacts and face a catastrophic future? Not obvious.
117/ On models' predictions: "Worst and best cases should be presented. Be particularly wary of worst-case scenarios presented as “business as usual.”
"Check the (in)consistency of coverage among various media outlets. Looking at the original papers is a good next step." (p.204)
"Check the (in)consistency of coverage among various media outlets. Looking at the original papers is a good next step." (p.204)

118/ "According to the IPCC, just stabilizing human influences on the climate would require global annual per capita emissions of CO₂ to fall to less than one ton by 2075, a level comparable to today’s emissions from such countries as Haiti, Yemen, and Malawi.
119/ "For comparison, 2015 annual per capita emissions from the U.S., Europe, and China were, 17, 7, & 6 tons.
"Energy demand increases strongly and universally with rising economic activity and quality of life; global demand is expected to grow by 50% through midcentury.
"Energy demand increases strongly and universally with rising economic activity and quality of life; global demand is expected to grow by 50% through midcentury.
120/ "Fossil fuels supply 80% of the world’s energy today and remains the most reliable means to meet energy demand.
"The energy-supply infrastructure of electric generating plants, transmission lines, refineries, and pipelines changes slowly for unavoidable structural reasons.
"The energy-supply infrastructure of electric generating plants, transmission lines, refineries, and pipelines changes slowly for unavoidable structural reasons.
121/ "Even if developed countries' emissions were to halve and per capita emissions of the developing world grew only to those of today’s lower-emitting developed countries, annual global emissions would still increase by midcentury.
122/ "The tension between emissions reductions and economic development is complicated by uncertainties in how the climate will change under human and natural influences and how those changes will affect natural and human systems.
123/ "Decisions must balance the cost and efficacy of mitigation measures against the certainties and uncertainties in climate science.
124/ "And where your interests come out in that balancing act will depend in part upon what country you’re in, how wealthy you are, and how much you care about (or whether you’re a member of) the 40% of humanity that doesn’t have access to adequate energy." (p. 213)
125/ "The climate’s response to greenhouse gases is so uncertain that if we thought our emissions had been reduced enough to keep us “safe” at a warming of 2ºC, the actual temperature might rise anywhere between 1ºC-3ºC. And the newest generation of models is even more uncertain.
126/ "Warming of <2ºC is likely to have a small net positive economic impact from improved agricultural conditions & reduced heating costs in the temperate northern latitudes. And, as we’ve seen, warming of 2-5°C is projected to have little net economic impact over time." (p.214)
127/ "There are only about 1.3 billion people in the developed countries of the Organization for Economic Cooperation and Development that make up the upper portion of this chart, with some 6.5 billion people in the lower portion, increasing energy use as they become better off.


128/ "Because there are five times as many people “developing” as there are “developed,” the total emissions from the developed and developing worlds are now just about equal. But the very different growth rates of these two worlds have some sobering implications.

129/ "For this century, cumulative emissions from the developing world will be larger than from the developed world. Under current trends, each 10% emission reduction in the developed world (which it has barely managed in 15 years) will offset <4 years of developing-world growth.
130/ "If nothing changed except that India’s per capita emissions grew to be equal to those today of, say, Japan—one of the lowest emitting of the developed countries—global emissions would increase by more than 25%.
131/ "As was clear even in 2015, which the agreement was signed, the modest reductions in 2030 emissions that would be achieved if all Paris pledges were met in 2030 are a long way from what would be needed to see emissions vanish." (p. 220)

132/ "Emissions restraints would have to be in place everywhere to be effective, or else carbon-intensive activities like heavy manufacturing will simply shift to regions without restraints. This is the nub of the challenge in reducing human influences." (p. 223)
133/ "The developing world has a host of far more immediate and pressing problems facing it (including adequate energy, transportation, housing, public health issues like clean water and sanitation, and education—not to mention recovery from COVID-19).
134/ "Who will pay the developing world not to emit? I have been posing that simple question to many people for more than fifteen years and have yet to hear a convincing answer." (p. 224)
135/ "I once asked a well-to-do audience in the U.S. if it understood what it would mean to eliminate its “carbon footprint” next year: that is, to zero out emissions associated with personal behaviors. Air travel, large homes (and second homes), and meat would be verboten.
136/ "There wasn’t much enthusiasm for any of that, although some were interested in “meatless meat.” More than a few thought that vague, unspecified “technology” and “policies” could let their children and grandchildren have a “carbon-neutral” existence without too much pain.
137/ "It would have to happen in every country, even as most of the world needs more energy for the minimal quality of life we take for granted in the developed world.
"Neither the major sources of U.S. emissions nor the amounts have changed much over the past 30 years." (p.226)
"Neither the major sources of U.S. emissions nor the amounts have changed much over the past 30 years." (p.226)

138/ "Still, there has been progress in the per capita sense: the country’s population grew 31% and its real GDP doubled. Total US energy-related emissions fell 16% from their peak in 2005, mostly because of changes in electricity generation led by natural gas replacing coal.
139/ "The off-shoring of energy-intensive manufacturing also played a role, though this simply shifts emissions to other countries.
"The average reduction of 1% a year from 2005 is meaningless both because of the scientific realities of how concentration relates to emissions
"The average reduction of 1% a year from 2005 is meaningless both because of the scientific realities of how concentration relates to emissions
140/ "and because the reductions that matter are global—while U.S. emissions declined after 2005, global emissions still increased by one-third.
"The economic slowdown caused by the COVID-19 pandemic demonstrates just how challenging it will be to reduce emissions rapidly.
"The economic slowdown caused by the COVID-19 pandemic demonstrates just how challenging it will be to reduce emissions rapidly.
141/ "Global CO₂ emissions during the first half of 2020 were down only 8.8% compared to the same period in 2019, with 40% of that reduction coming from surface transport and 22% from the electricity sector. Emissions rebounded promptly in many countries as restrictions eased.
142/ "Even as new sources of energy have come online, older sources have not disappeared.
"Energy systems change slowly for good reasons. Delivery must be highly reliable—when fuel supplies are disrupted or there’s an electrical blackout, society comes to a halt; chaos ensues.
"Energy systems change slowly for good reasons. Delivery must be highly reliable—when fuel supplies are disrupted or there’s an electrical blackout, society comes to a halt; chaos ensues.

143/ "High reliability comes only after decades of developing & optimizing hardware and operating procedures.
"Energy supply facilities such as power plants or refineries require large up-front investments & last for decades (over which those investments are gradually paid off).
"Energy supply facilities such as power plants or refineries require large up-front investments & last for decades (over which those investments are gradually paid off).
144/ "They must also be compatible with other parts of the infrastructure—fuels, fueling infrastructure, and vehicles must all work together.
"Energy-use systems can evolve more quickly, though cars remain on the road for 15 years; buildings are refreshed only after decades.
"Energy-use systems can evolve more quickly, though cars remain on the road for 15 years; buildings are refreshed only after decades.
145/ "For someone to invest an extra billion dollars in an emissions-lite power plant lasting 50 years, she needs a reasonable expectation that those emissions reductions would still be valued decades later. (That’s more than a few Congresses and presidential terms.)
146/ "Governments are not well equipped to handle the long timescales inherent in reducing greenhouse gas emissions. Politicians outbid one another by proposing ever greater reductions 30 years in the future, through programs that won’t even begin until after they’ve left office.
147/ "The haggling over emissions reductions that we’ve seen among EU countries and between EU industries and the governments suggests that implementing those programs won’t be simple." (p. 230)
148/ "As the challenges of reducing emissions have become evident, geoengineering can be discussed in polite company, even by governments.
"There are many ways we might further enhance albedo, including brightening the land surface with “white roofs” on buildings,
"There are many ways we might further enhance albedo, including brightening the land surface with “white roofs” on buildings,
149/ "engineering crops to be more reflective, brightening the ocean with surface microbubbles, and putting up giant reflectors in space.
"Creating aerosols might be most plausible. The haze in the stratosphere after major volcanic eruptions cools the planet for a few years.
"Creating aerosols might be most plausible. The haze in the stratosphere after major volcanic eruptions cools the planet for a few years.
150/ "It is well within the capabilities of current technology to create a stratospheric haze via any of a number of methods, including additives to jet fuel or artillery shells that disperse the gas hydrogen sulfide (H₂S, which smells like rotten eggs) at high altitude.
151/ "The amount of sulfur added to the stratosphere each year would be only one-tenth of that humans currently emit at much lower altitudes, so direct health impacts would be minimal. Projected costs are low enough that even a wealthy individual could carry out the project.
152/ "If the haze were not sustained, the global temperature would rebound rapidly.
"Climate models also suggest that solar radiation management would cause small changes in precipitation and other aspects of the climate system." (p. 240)
Thread on this:
"Climate models also suggest that solar radiation management would cause small changes in precipitation and other aspects of the climate system." (p. 240)
Thread on this:
https://twitter.com/ReformedTrader/status/1382758191650414593
153/ "Given the enormous challenges of effectively reducing emissions & the concerns that make geoengineering likely to be deployed only in extremis, it seems all but certain that efforts to reduce emissions will be complemented, if not overshadowed, by adaptation to the climate.
154/ "Adaptation is tailored to the needs of different populations, making it more politically feasible. Spending for “here and now” (e.g., flood control for a local river) is far more palatable than to counter an uncertain threat thousands of miles and two generations away.
155/ "Local adaptation does not require the global consensus/commitment/coordination that have proved so far elusive in mitigation efforts.
"The Dutch have been building dikes for centuries to claim land from the North Sea. Adaptation will happen whether we plan for it or not.
"The Dutch have been building dikes for centuries to claim land from the North Sea. Adaptation will happen whether we plan for it or not.
156/ "Societies have thrived in environments ranging from the Arctic to the Tropics.
"Like most things, effective adaptation is easier in wealthier societies, which have institutional and economic resources to change with circumstances. Less developed countries are more fragile.
"Like most things, effective adaptation is easier in wealthier societies, which have institutional and economic resources to change with circumstances. Less developed countries are more fragile.
157/ "The best way to enable adaptation is to encourage economic development of less developed countries and strengthen governance (such as rule of law or the ability to execute national strategies). The task of enabling adaptation becomes that of alleviating poverty." (p. 246)
159/ Near-real-time monitoring of global CO2 emissions reveals the effects of the COVID-19 pandemic
https://twitter.com/ReformedTrader/status/1449468582954373121
• • •
Missing some Tweet in this thread? You can try to
force a refresh