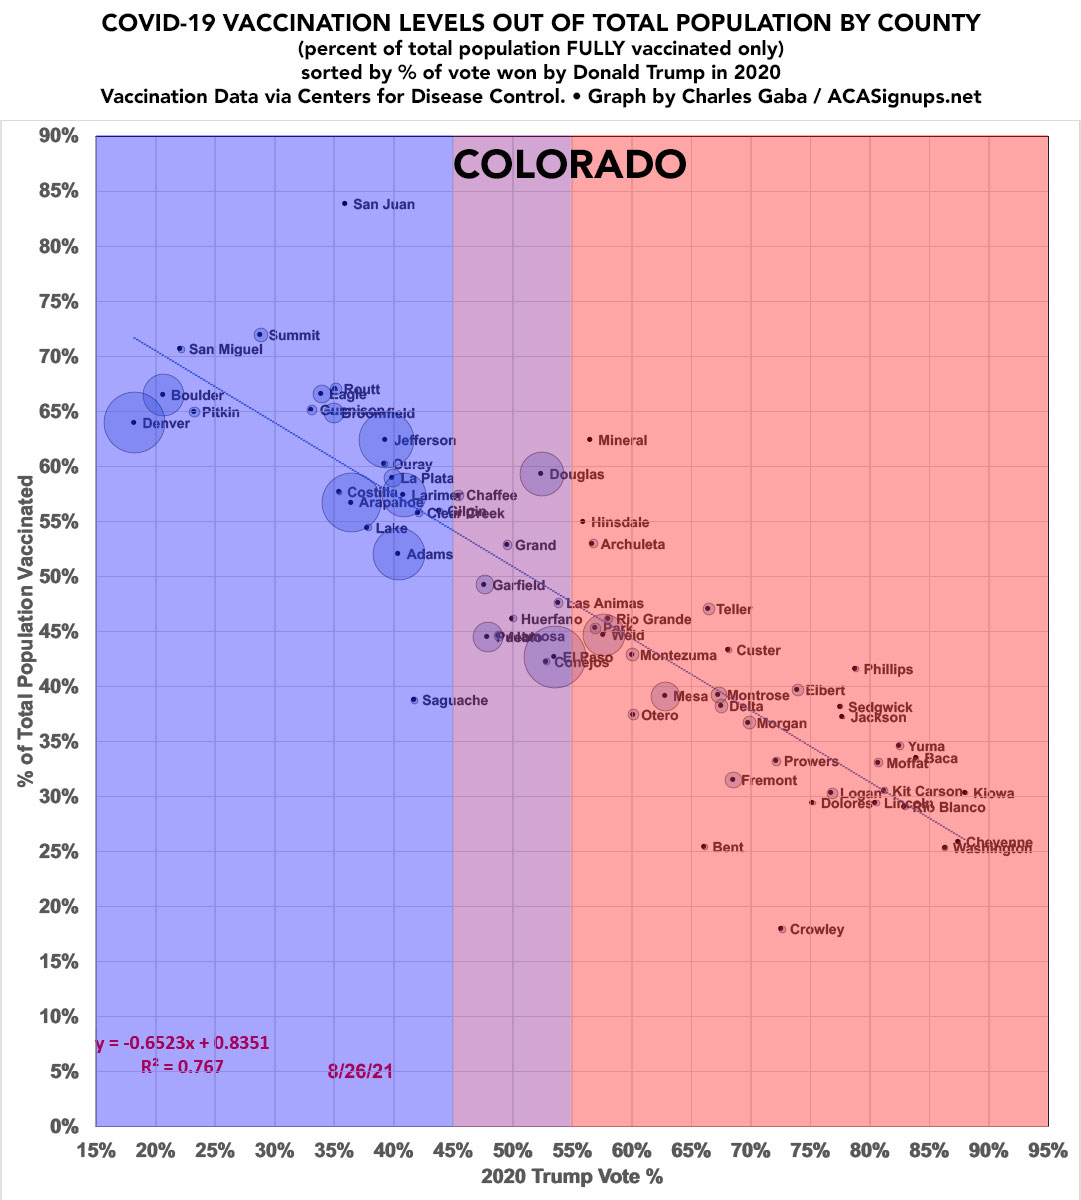
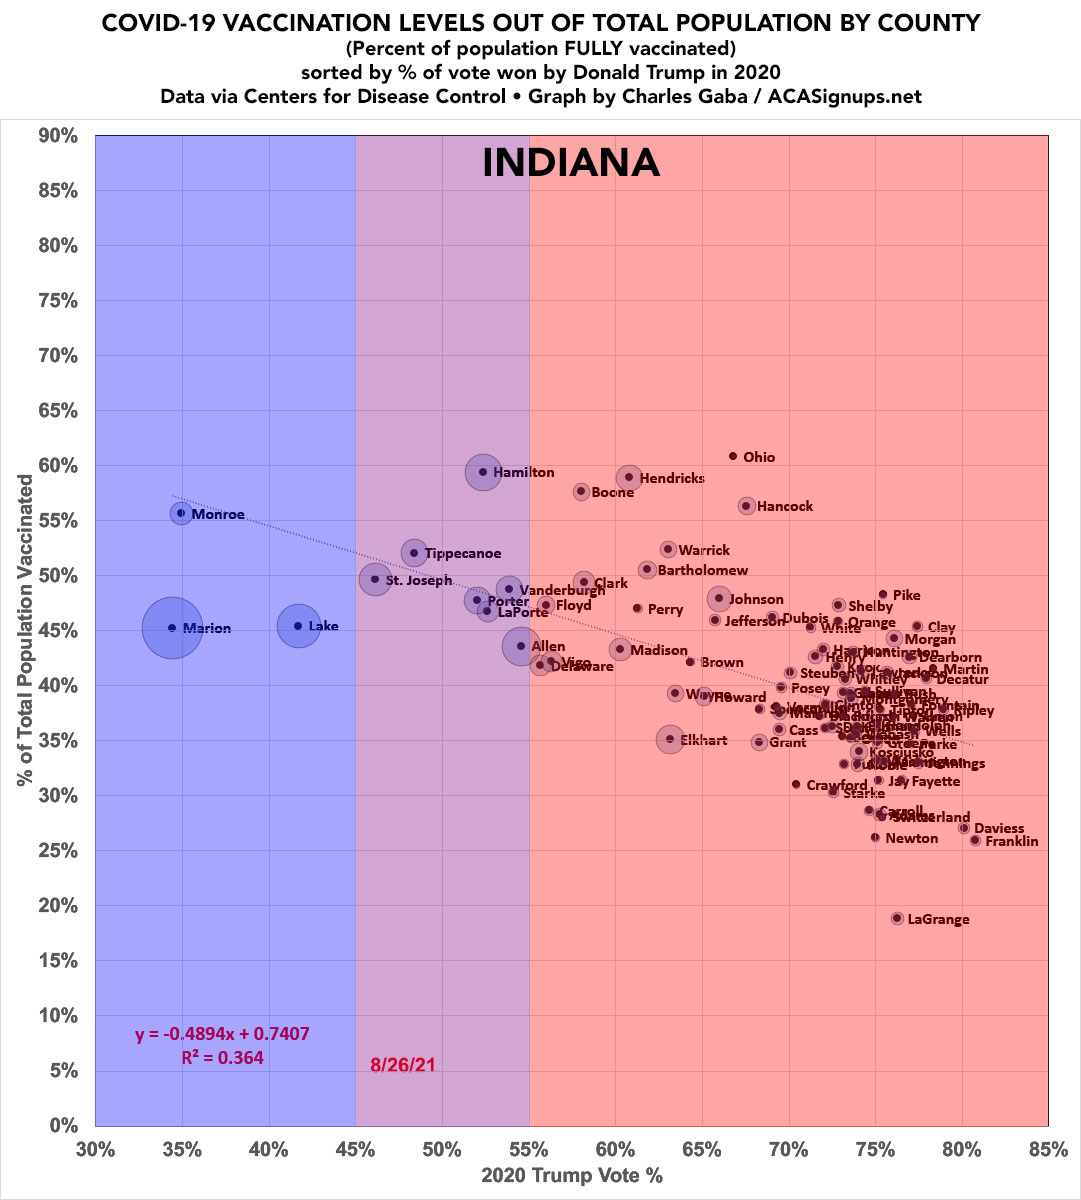
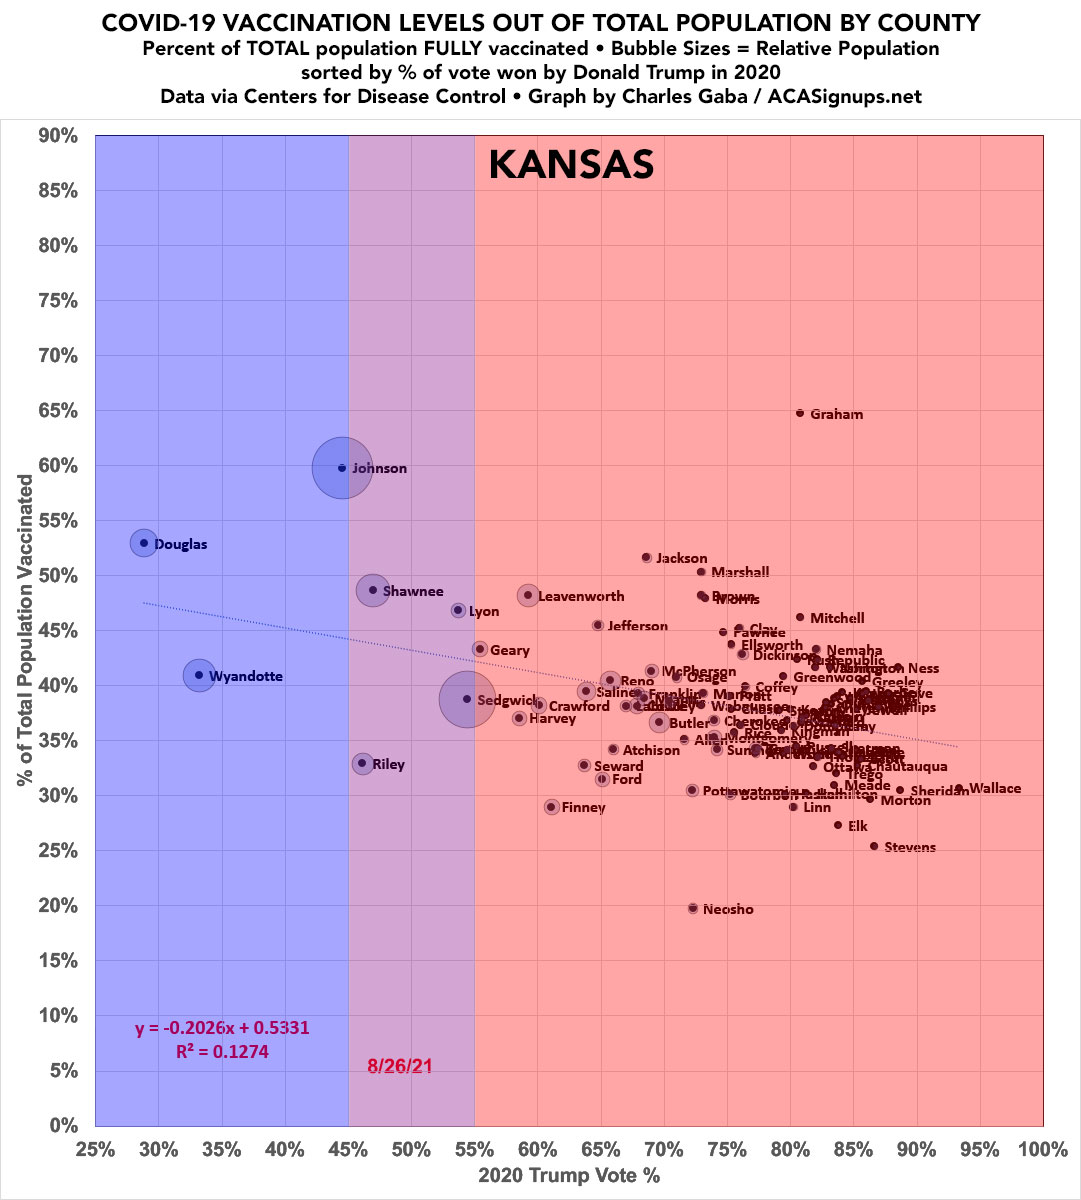
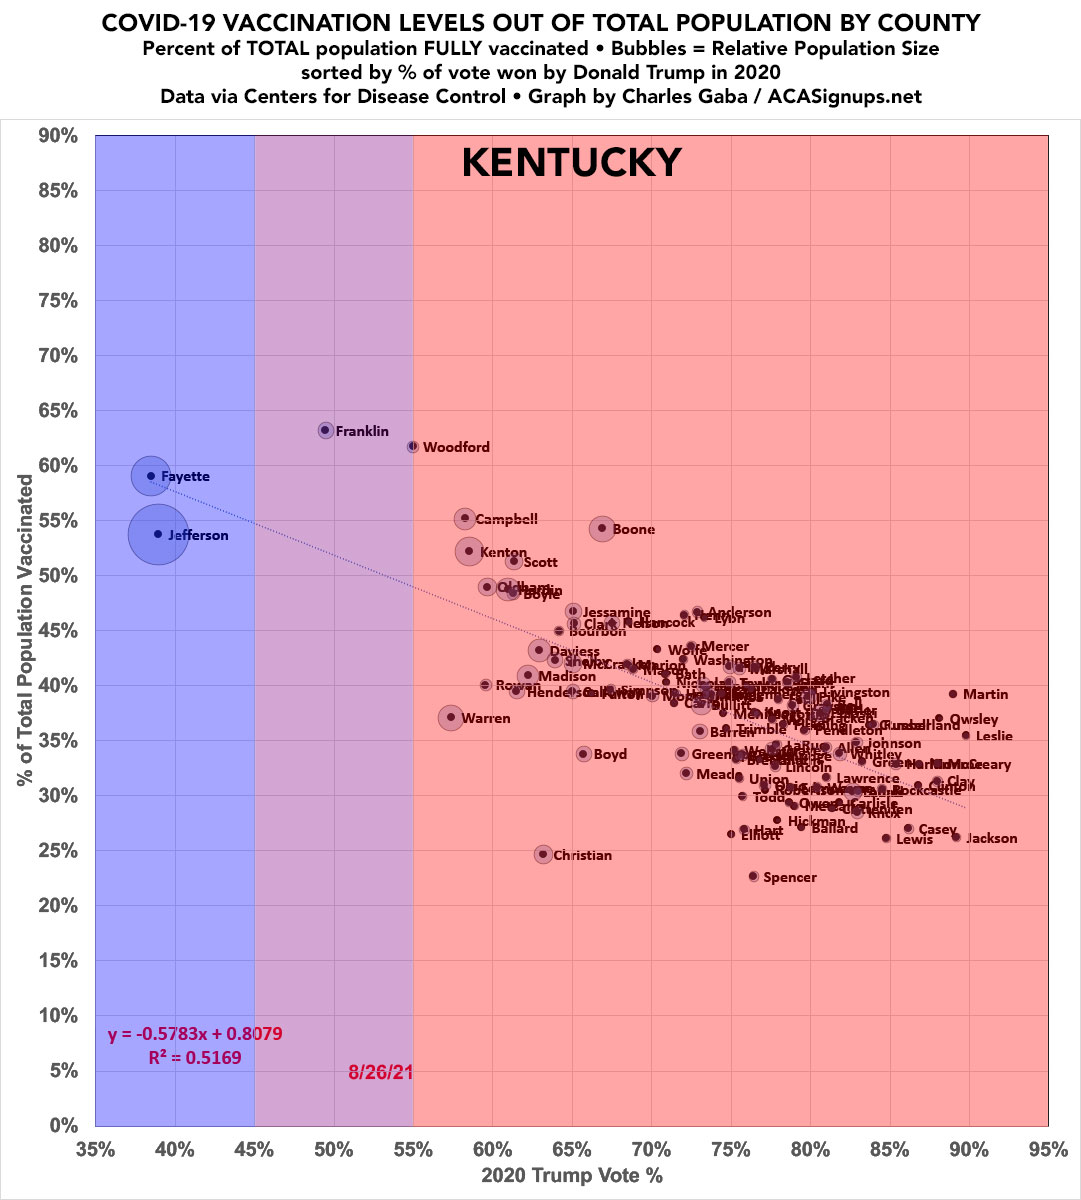
📣📣 It's been about 6 weeks *and* I've updated everything with the official 2020 Census data, so it's time once again to look at the county-level vaccination rates for each individual state!
First up...Alabama:
First up...Alabama:

ARIZONA. I've actually decided to start scrapping the "herd immunity threshold" line since a) we don't know how high it actually is and b) it clutters up the graphs. Let's just say every county SHOULD be as close to the top as possible. 

ARKANSAS. Yes, Miller County has only vaccinated 10% of their population. They have 42,600 residents and gave Trump 72% of their vote. 

CONNECTICUT, DELAWARE, DC, HAWAII & RHODE ISLAND (none of these have more than 8 counties to begin with so it doesn't make much sense to look for a pattern, but I've included them for completeness anyway): 

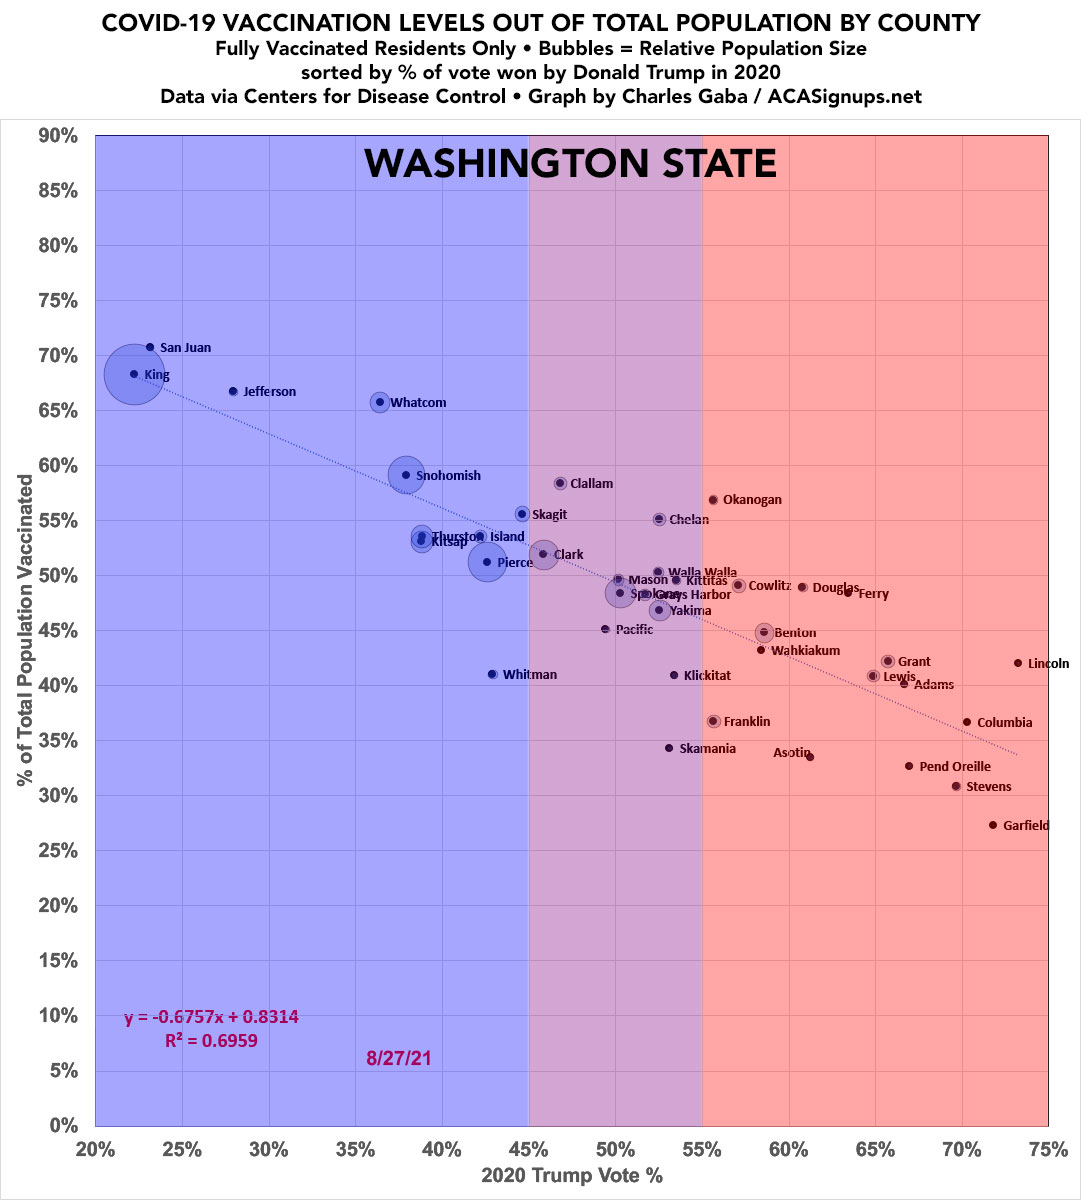
FLORIDA. Sumter County is, of course, home to The Villages, the massive retirement community where Trump held rallies last summer.
Miami-Dade is 66% vaxxed yet still has high case rates. I have no idea about the *death* rate there recently, however; FL isn't breaking that out.
Miami-Dade is 66% vaxxed yet still has high case rates. I have no idea about the *death* rate there recently, however; FL isn't breaking that out.
LOUISIANA.
I still don't know what the deal is with West Feliciana, unless it's the Louisiana State Prison...in which case that's a GOOD thing as it means the prisoners are highly vaccinated?
I still don't know what the deal is with West Feliciana, unless it's the Louisiana State Prison...in which case that's a GOOD thing as it means the prisoners are highly vaccinated?

Have to take a break for awhile, will get the rest of the states this evening. Meanwhile, if you find my work useful you can support it here, thanks!
ACASignups.net/support
ACASignups.net/support
MASSACHUSETTS. I've had to revise Dukes & Nantucket about 4 times based on conflicting vaccination data sources, but I think I have it right now. 

NEW JERSEY.
Worth noting that the state with the highest cumulative COVID death rate has the *weakest* partisan lean effect of all 50 states.
(No, Florida still hasn't surpassed New Jersey on this front unless they're hiding over 21,000 deaths...which I admit is conceivable)
Worth noting that the state with the highest cumulative COVID death rate has the *weakest* partisan lean effect of all 50 states.
(No, Florida still hasn't surpassed New Jersey on this front unless they're hiding over 21,000 deaths...which I admit is conceivable)

NORTH CAROLINA.
Here we run into a data-tracking headache (h/t @DavidNir for calling my attention to it): The @CDCgov data claims to be 96.3% complete for NC...but the @NCDHHS claims that Martin County, which CDC says is nearly 80% vaxxed, is actually only 42%.

Here we run into a data-tracking headache (h/t @DavidNir for calling my attention to it): The @CDCgov data claims to be 96.3% complete for NC...but the @NCDHHS claims that Martin County, which CDC says is nearly 80% vaxxed, is actually only 42%.


If NC only had 1 county which was significantly off, I'd just take note of it going forward and move on, but there's a BUNCH of NC counties where the CDC & NCDHHS show differences of > 5%...and several which are over 10% off.
Any insight from @cyrusshahpar46 appreciated :)
Any insight from @cyrusshahpar46 appreciated :)

SOUTH DAKOTA, currently in the midst of an ugly post-#SturgisRally COVID spike.
Yes, according to the CDC data, McPherson County, SD is less than 10% vaccinated.
(Sturgis is in Meade County, which is buried in the middle of that blob in the red section)
Yes, according to the CDC data, McPherson County, SD is less than 10% vaccinated.
(Sturgis is in Meade County, which is buried in the middle of that blob in the red section)

TEXAS.
Texas has a whopping 254 counties, ranging from Harris County's 4.7 million residents to tiny Loving County, which has a whopping 64 residents according to the official 2020 Census.
I have no idea what the deal is with Hudspeth County; if someone knows please clue me in.
Texas has a whopping 254 counties, ranging from Harris County's 4.7 million residents to tiny Loving County, which has a whopping 64 residents according to the official 2020 Census.
I have no idea what the deal is with Hudspeth County; if someone knows please clue me in.

VIRGINIA.
VA is kind of all over the place, possibly because they have this weird hybrid system in which half the counties are actually "independent cities" which are also considered counties.
Note that @CovidActNow doesn't list Manassas City or Manassas Park for some reason.
VA is kind of all over the place, possibly because they have this weird hybrid system in which half the counties are actually "independent cities" which are also considered counties.
Note that @CovidActNow doesn't list Manassas City or Manassas Park for some reason.

WEST VIRGINIA.
WV started out boasting the highest vaccination rate last spring when it was restricted to seniors...but quickly fell behind once the vaccines became available to everyone.
WV started out boasting the highest vaccination rate last spring when it was restricted to seniors...but quickly fell behind once the vaccines became available to everyone.

Before I wrap things up, a reminder that if you find my work useful & want to support it, you can do so here, thanks!
acasignups.net/support
acasignups.net/support
Annnnnnd here's WYOMING, the smallest state in the country, with an R^2 correlation of an eye-popping 0.8838: 

I've personally renamed Teton County, Wyoming "Thor's Twins" after this famous scene from The Hunt for Red October.
⚠️ WANT TO SEE ALL 3,144 COUNTIES AT ONCE? I update the national version of this weekly:
acasignups.net/21/08/25/weekl…
acasignups.net/21/08/25/weekl…
• • •
Missing some Tweet in this thread? You can try to
force a refresh


