One under-appreciated finding in the IPCC AR6 is a lot more certainty around future warming.
Previously IPCC only gave "likely" warming ranges (e.g. a 2 in 3 chance of falling in the range). New report gives "very likely" 9 in 10 ranges. Here is a rough like-to-like comparison:
The IPCC AR5 future warming projections were nominally based on the 90th percentile of CMIP5 models, but the assessed range of climate sensitivity was much wider than the range in CMIP5 models, so these were treated "likely" (66th percentile) ranges.
The AR6, on the other hand, bases its warming projections on a combination of observationally-constrained CMIP6 models and a simple energy balance model using the new transient climate response (TCR) and equilibrium climate sensitivity (ECS) values in the report.
Per the AR6 WG1 Chapter 4: "Because different approaches... produce consistent results, there is high confidence in this assessment. These ranges... generally correspond to AR5 ranges... but likelihood is increased to very likely ranges, in contrast to the likely ranges in AR5."
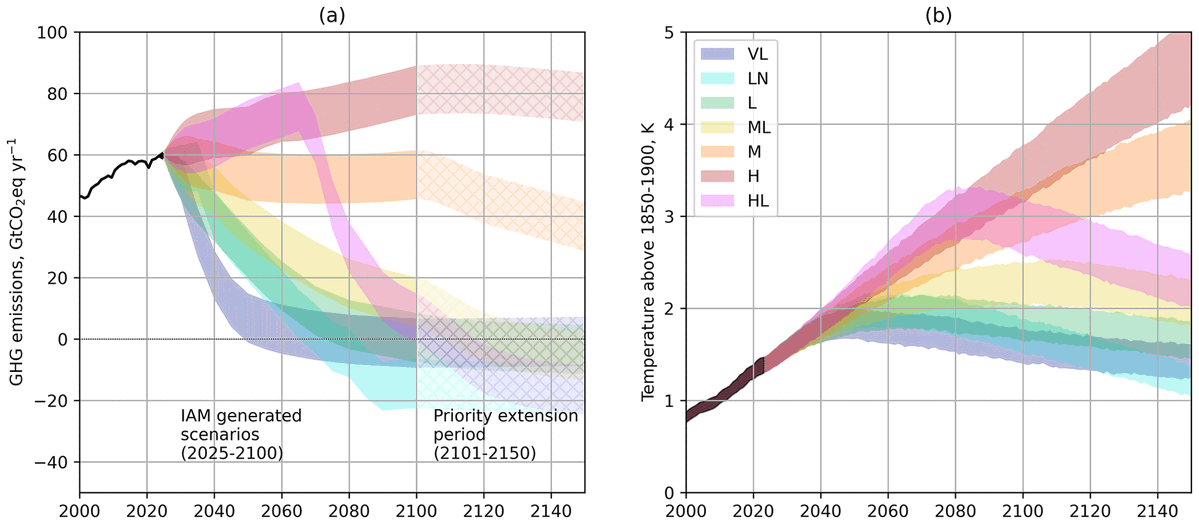
Here is what the published RCP AR5 warming projections look like compared to the SSP AR6 ones; note that the AR5 ranges are "likely" 66th percentile ranges and the AR6 ones are "very likely" 90th percentile ranges.
There were no "very likely" ranges published in the AR5 to allow a direct comparison of scenarios. However, if we scale the AR5 projections by the difference between "likely" and "very likely" climate sensitivity (ECS) ranges we can get a rough estimate:
As an aside, TCR would probably be better than ECS to use for scaling these, but as far as I can tell the AR5 did not provide a "very likely" TCR range.
This increased confidence in future warming projections was in part a result of a narrowing of the range of climate sensitivity in the AR6 through a combination of multiple lines of evidence, following the Sherwood et al review: agupubs.onlinelibrary.wiley.com/doi/full/10.10…
So why is this important? Narrowing the range of future warming represents both good and bad news: good news that some of the very high end warming outcomes now seems less likely, but bad that we much less likely to get lucky and end up with less warming than we expected.
• • •
Missing some Tweet in this thread? You can try to
force a refresh
My new State of the Climate report over at @CarbonBrief finds that 2025 had the:
⬆️ Warmest ocean heat content
⬆️ Tied as second warmest surface temps
⬆️ Second warmest troposphere
⬆️ Record high sea level and GHGs
⬇️ Record low winter Arctic ice
Read the article here:
Ocean heat content increased by 23 billion trillion joules, which was around 39 times greater than global primary energy use this year. This is the largest rise in OHC since 2017; overall OHC has increased by over 500 zettajoules since the 1940s.carbonbrief.org/state-of-the-c…
@CarbonBrief 2025 tied with 2023 as the second warmest surface temperatures. It was nominally the second warmest in NASA and DCENT datasets, and third warmest in NOAA, Hadley, Berkeley, Copernicus, JRA-3Q, and China-MST. In all cases uncertainties overlap with 2023.
After a modest decline over the first half of the year (and after record 2024 warmth), global temperatures are ticking back up. The past two days have been the warmest on record for this time of year in ERA5 and the highest temperature anomalies since January.
With 26 days of October now reporting in ERA5, October 2025 will be the third warmest on record after 2023 and 2024.
Weather models expect global temperatures to remain relatively flat over the coming week as extreme Northern Hemisphere warmth persists, and anomalies (departures from normal) will be at or above the levels the highest levels any we've seen earlier in the year
Last week the German Meteorological Society warned that "the 3-degree limit could be exceeded as early as 2050".
While not possible to fully rule out, the assessed warming scenarios we published in the IPCC AR6 report find this to be extremely unlikely.
If we look a the full ensemble of CMIP6 models we see a small number (3 of 37 models) reaching 3C by 2050. However, these three have both too much historical warming (~2.2C in 2024) and what an unrealistically high climate sensitivity (>5C per doubling CO2) as we noted here: nature.com/articles/d4158…
However, if we constrain CMIP6 to match recent observed global temperatures, we see no models reaching 3C until at least 2060: carbonbrief.org/analysis-what-…
The EPA cited my paper in their argument against the endangerment finding today. However, their point is completely backwards: my paper actually supports the EPA's 2009 range of 1.8C to 4C warming by 2100. nature.com/articles/d4158…
Specifically, in our paper we argue that RCP4.5 or RCP6.0 are more realistic representations of 2100 warming under current policy than the increasingly implausible RCP8.5 scenario. But the lower of those two – RCP4.5 – gives a 2100 warming range of 1.8C to 4C!
Its only the high end warming outcomes of >4C that have become increasingly unlikely as the world has moved toward lower emissions scenarios. The wide range of climate sensitivity and carbon cycle feedbacks still makes it impossible to rule out up to 4C: journals.sagepub.com/doi/10.1177/29…
I just published an explainer on aerosols and their role in the climate that I've been working on for the past few months! It includes both how aerosols work, how emissions have changed, and how thats driven recent warming (link below).
Human-caused emissions of aerosols – tiny, light‑scattering particles produced mainly by burning fossil fuels – have long acted as an invisible brake on global warming. This is largely because they absorb or reflect incoming sunlight and influence the formation and brightness of clouds.
Aerosols also have a substantial impact on human health, with poor outdoor air quality from particulate matter contributing to millions of premature deaths. Efforts to improve air quality around the world in recent decades have reduced aerosol emissions, bringing widespread benefits for health.
Whenever I post about climate, skeptical folks inevitable respond with this graph. So I decided to do something radical: actually read the underling scientific paper and ask the authors.
As it turns out, it actually says the opposite of what skeptics claim.
Rather than arguing against human influence on the climate, the paper makes the stark claim that "CO2 is the dominant driver of Phanerozoic climate [the past 485 million years], emphasizing the importance of this greenhouse gas in shaping Earth history."
Changes in temperature, it turns out, have been strongly correlated with CO2. Even more strongly than the authors expected when they set out to create a 485 million year reconstruction. CO2 is both a forcing (e.g. from volcanism) and a feedback (from solar forcing) at different points.